How to debug ionic apps during development?

This article is the first part of a two-part article on how to debug ionic apps. The techniques described here are helpful if your app is in debug mode. If you are looking for ways to debug an app in prod(signed release), please look at part two of this article.
1- Remote debugging during development using Web View
](https://cdn-images-1.medium.com/max/2624/0*7PMXkw-jrU9Rnakb.png) from Ionic website: Web Views power web apps on native devices
from Ionic website: Web Views power web apps on native devices
Ionic apps (native apps) are web apps that run in an embedded browser, so you can use remote debugging with chrome dev tools on Android or Safari Web Inspector on iOS to debug JavaScript, HTML and CSS.
You can use remote debugging with an actual device or simulator. If you use a real device, ensure that debugging is enabled both from the device and on the remote browser.
In Android, you need to go to the settings and enable developer mode first and then USB Debugging under the developer options menu.
If you do not see the Developer options menu, you need first to enable it. To do that, go to About phone > Software information find the build number and tap on it until you get the confirmation for enabling developer options. Then the Developer options menu will be available at the same level as About phone menu option.
To enable remote debugging for android. Open a new chrome tab and type in chrome://inspect this will show you all the web views available for debugging, grouped by app name.
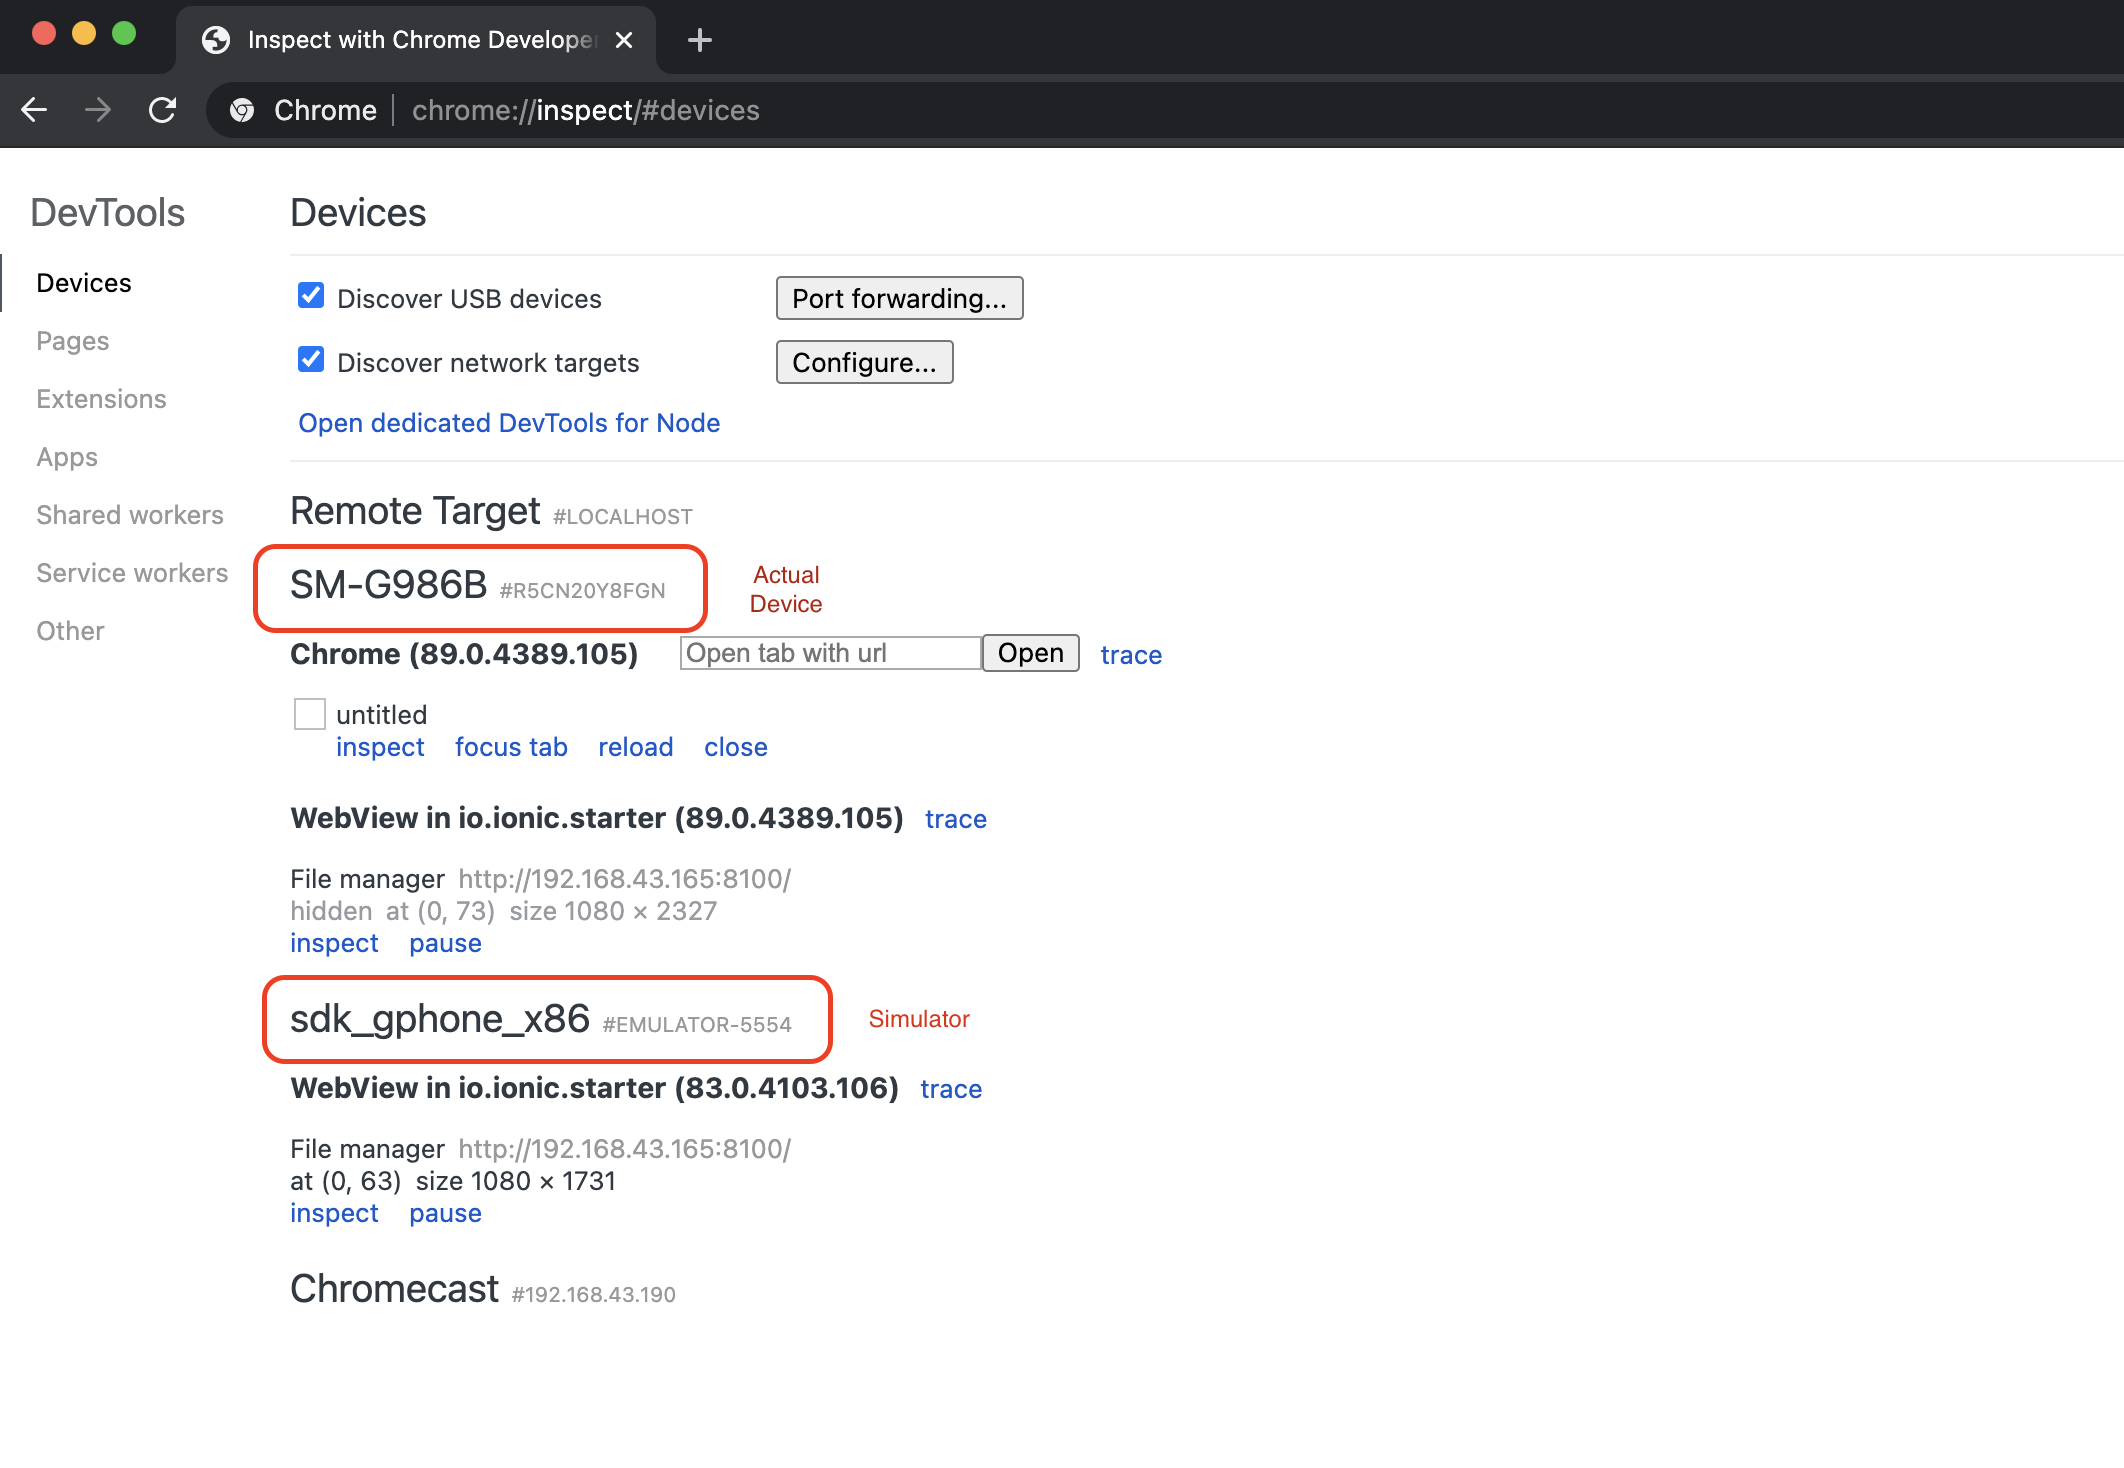 Chrome inspect devices tab, showing apps that can be debugged on Simulator and Actual Device
iOS is very similar. Open Safari and find the menu that reads Develop from there; find the device you want to debug. Open the device menu, and you will see all available apps(Web Views) to debug. If you do not see the Develop menu, you need to go to Safari preferences and enable developer mode from the advanced settings. Also, make sure that the developer option is enabled on the actual device you use for debugging.
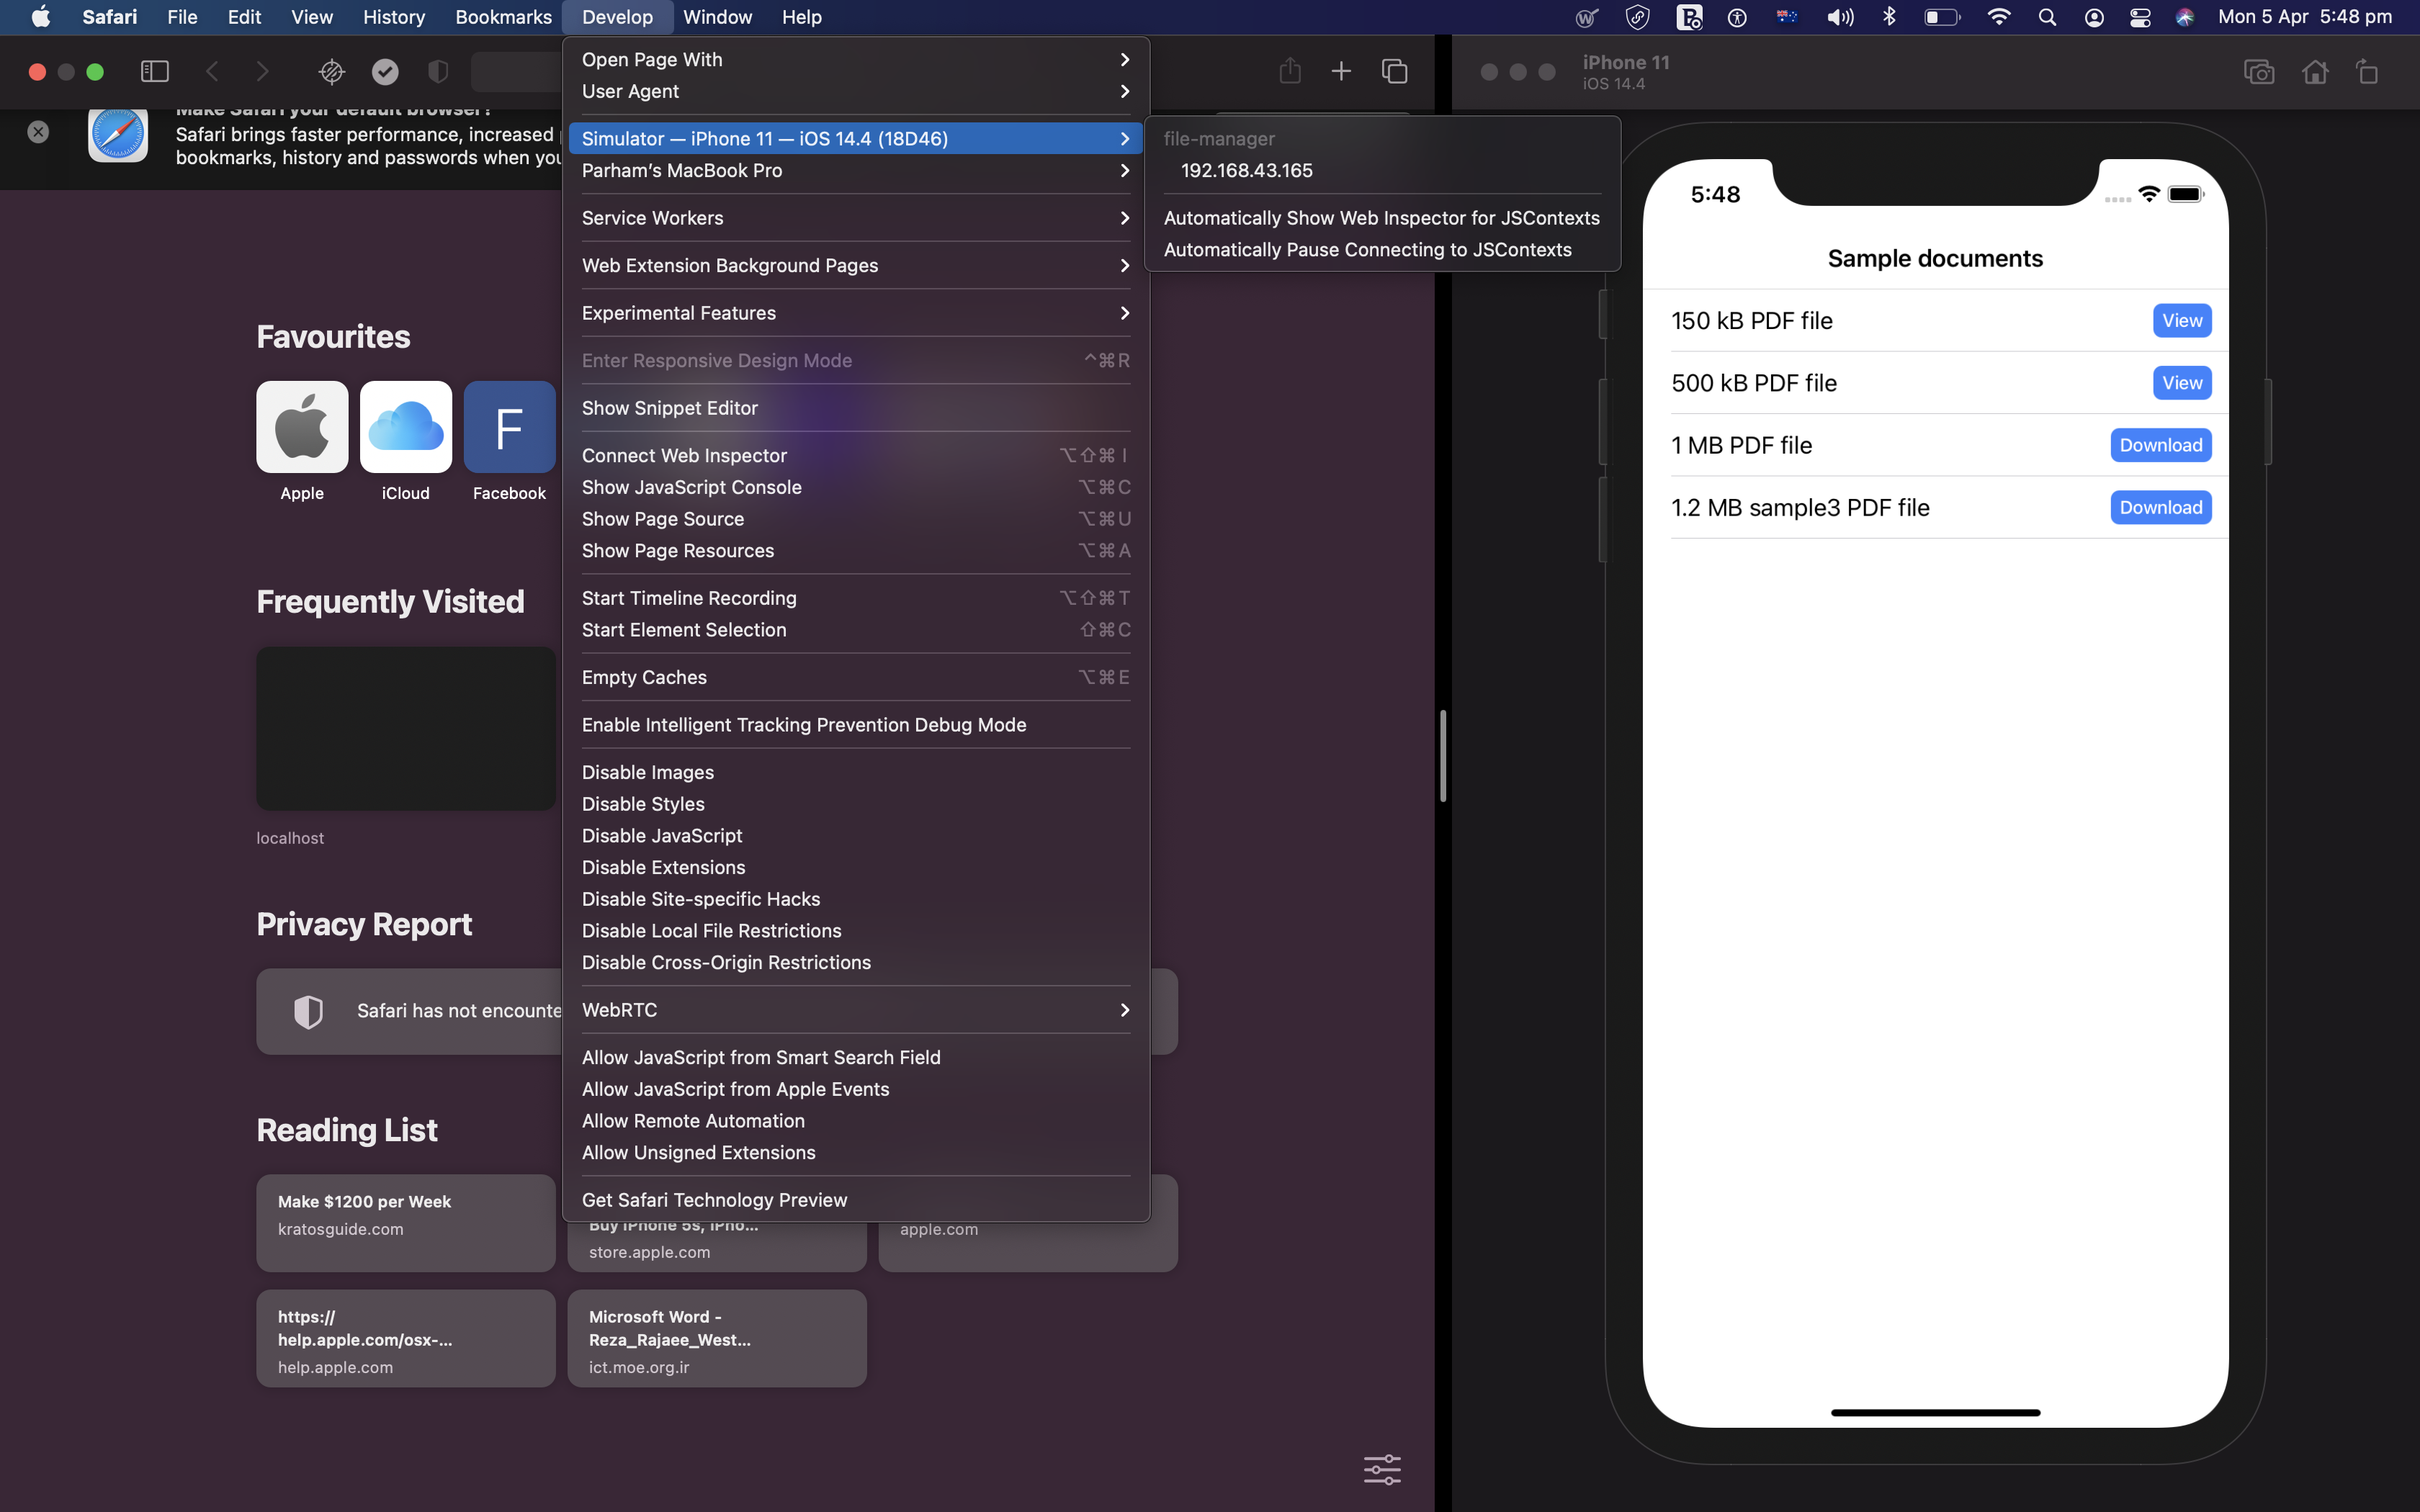 Develop menu in Safari Desktop
You can use console methods like console.log and look at runtime logs to see how your app works. Also, you can use the JS debugger as you would do with a standard web application. You can inspect DOM and manipulate HTML and CSS for debugging.
Here is an example of remote debugging using Safari web inspector running the app on iOS simulator.
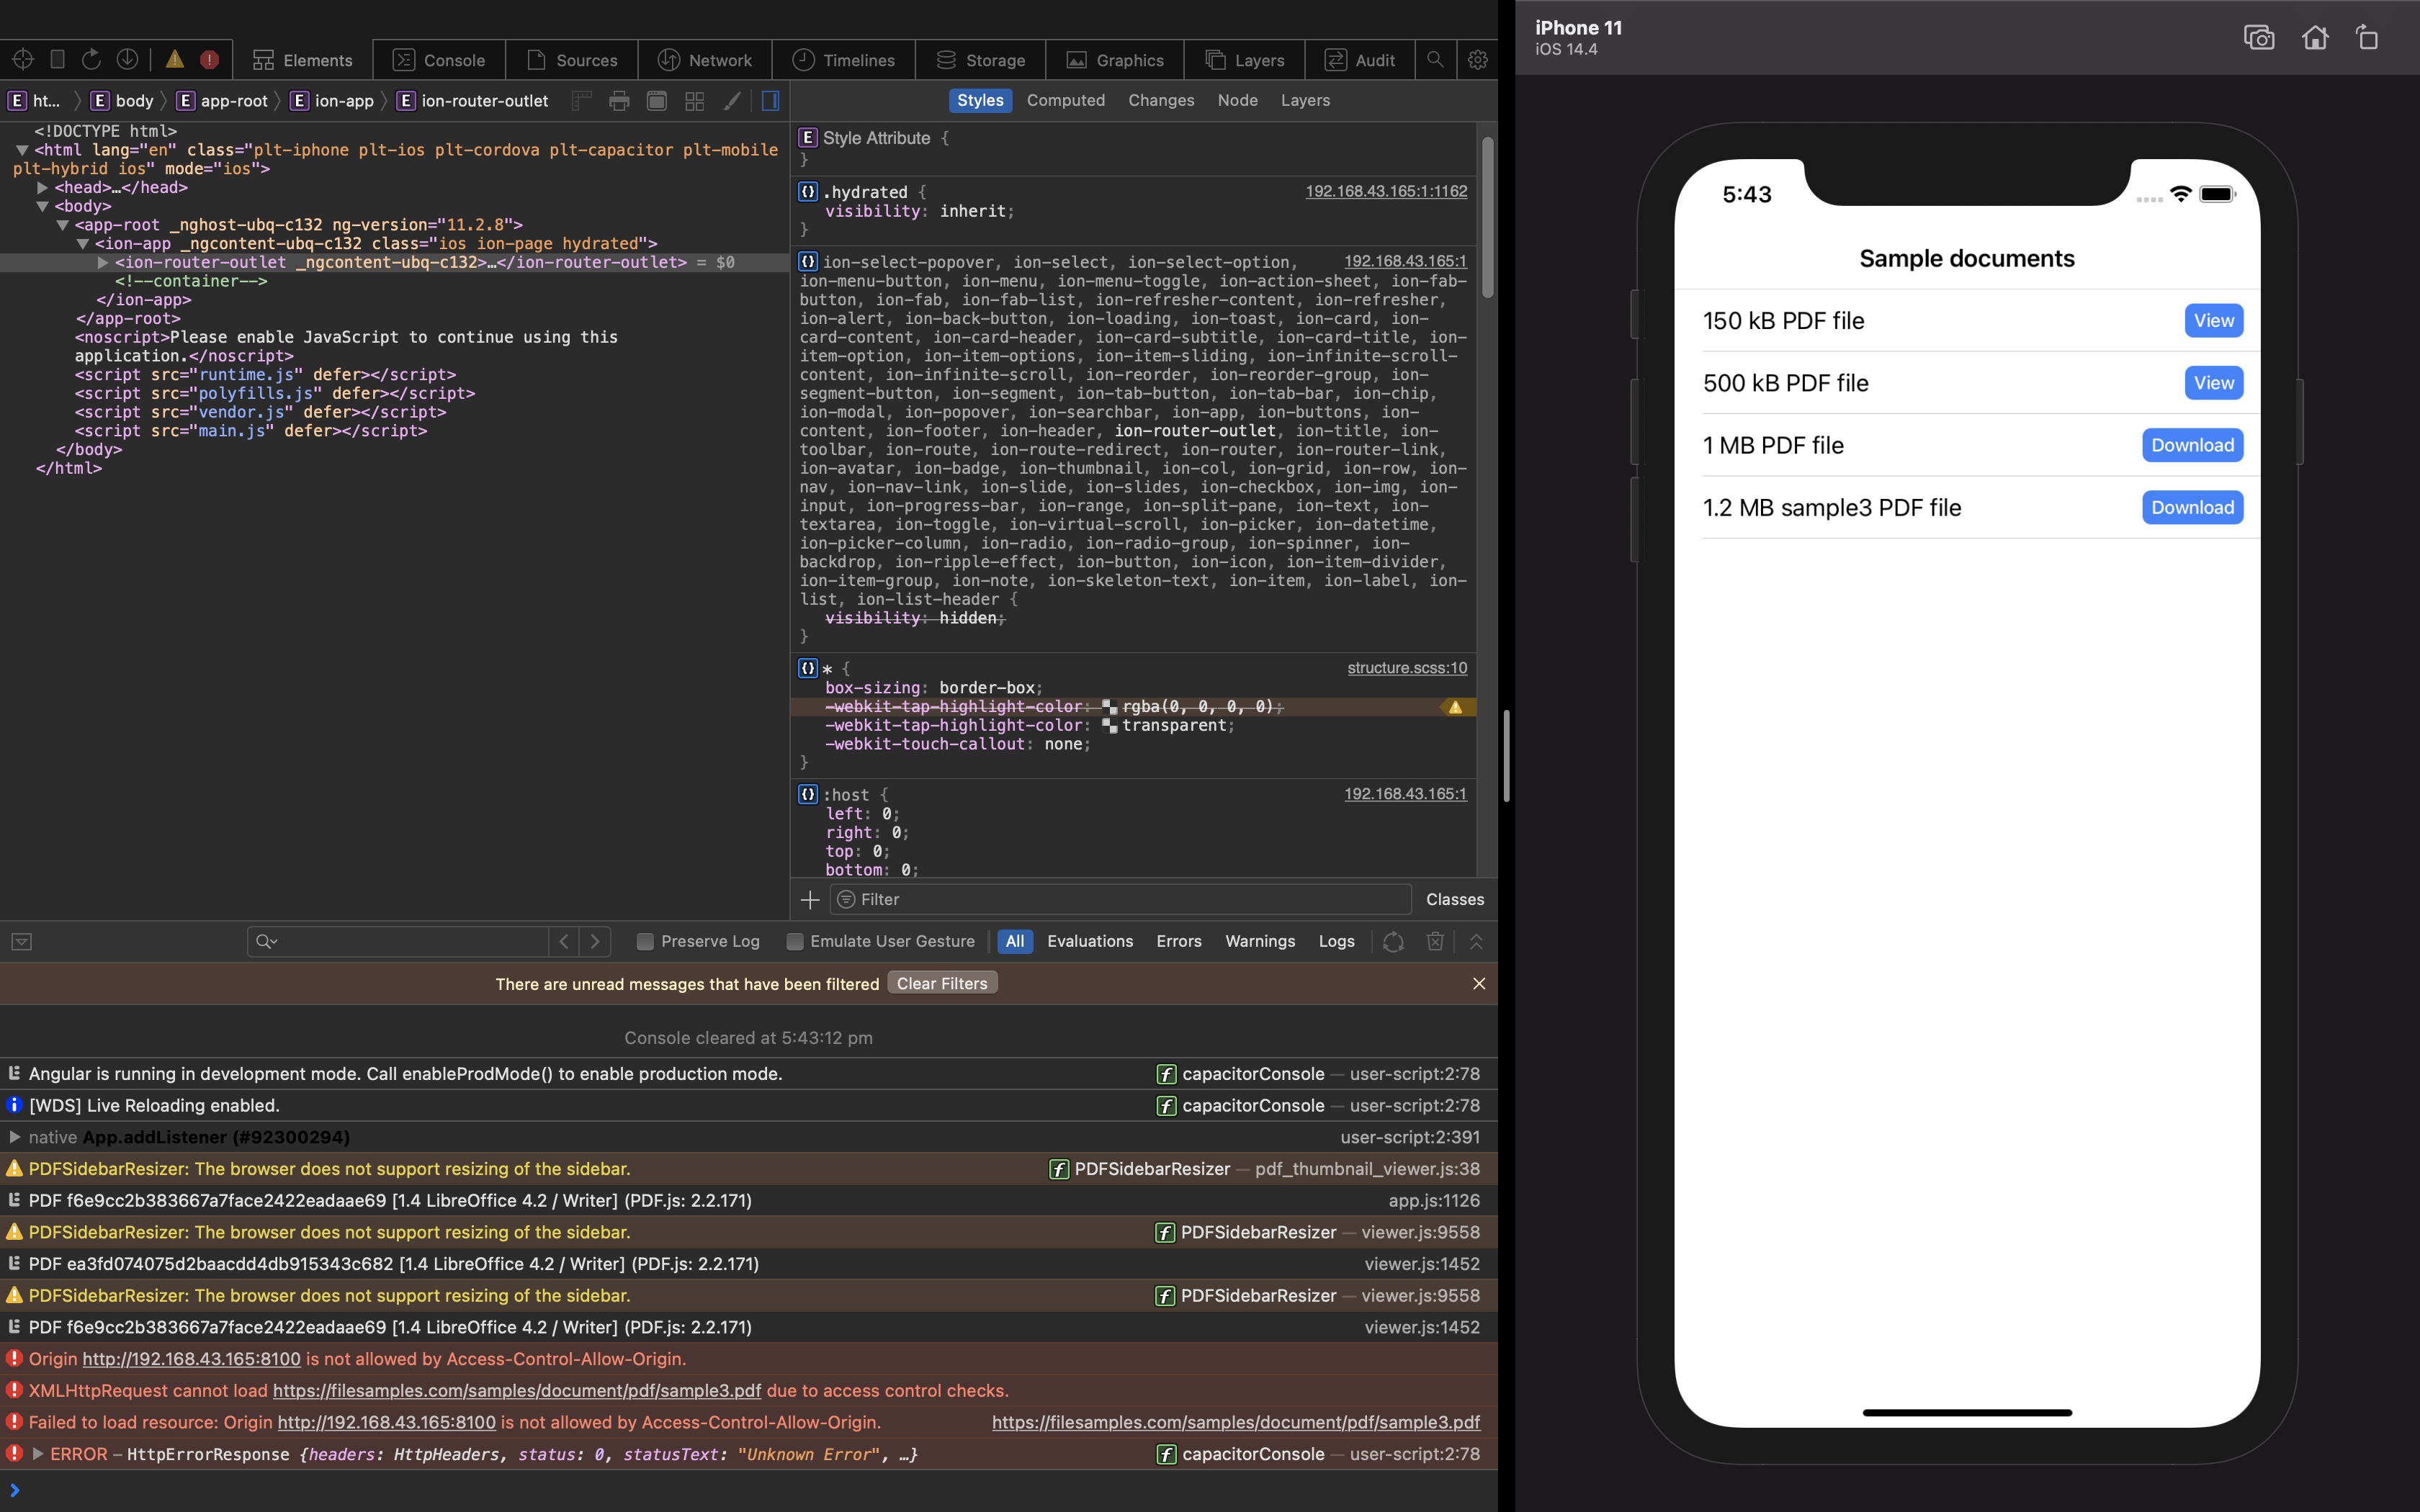 Remote debugging using Safari web inspector running the app on iOS simulator
Here is an example of remote debugging using Chrome DevTools running the app on Android simulator.
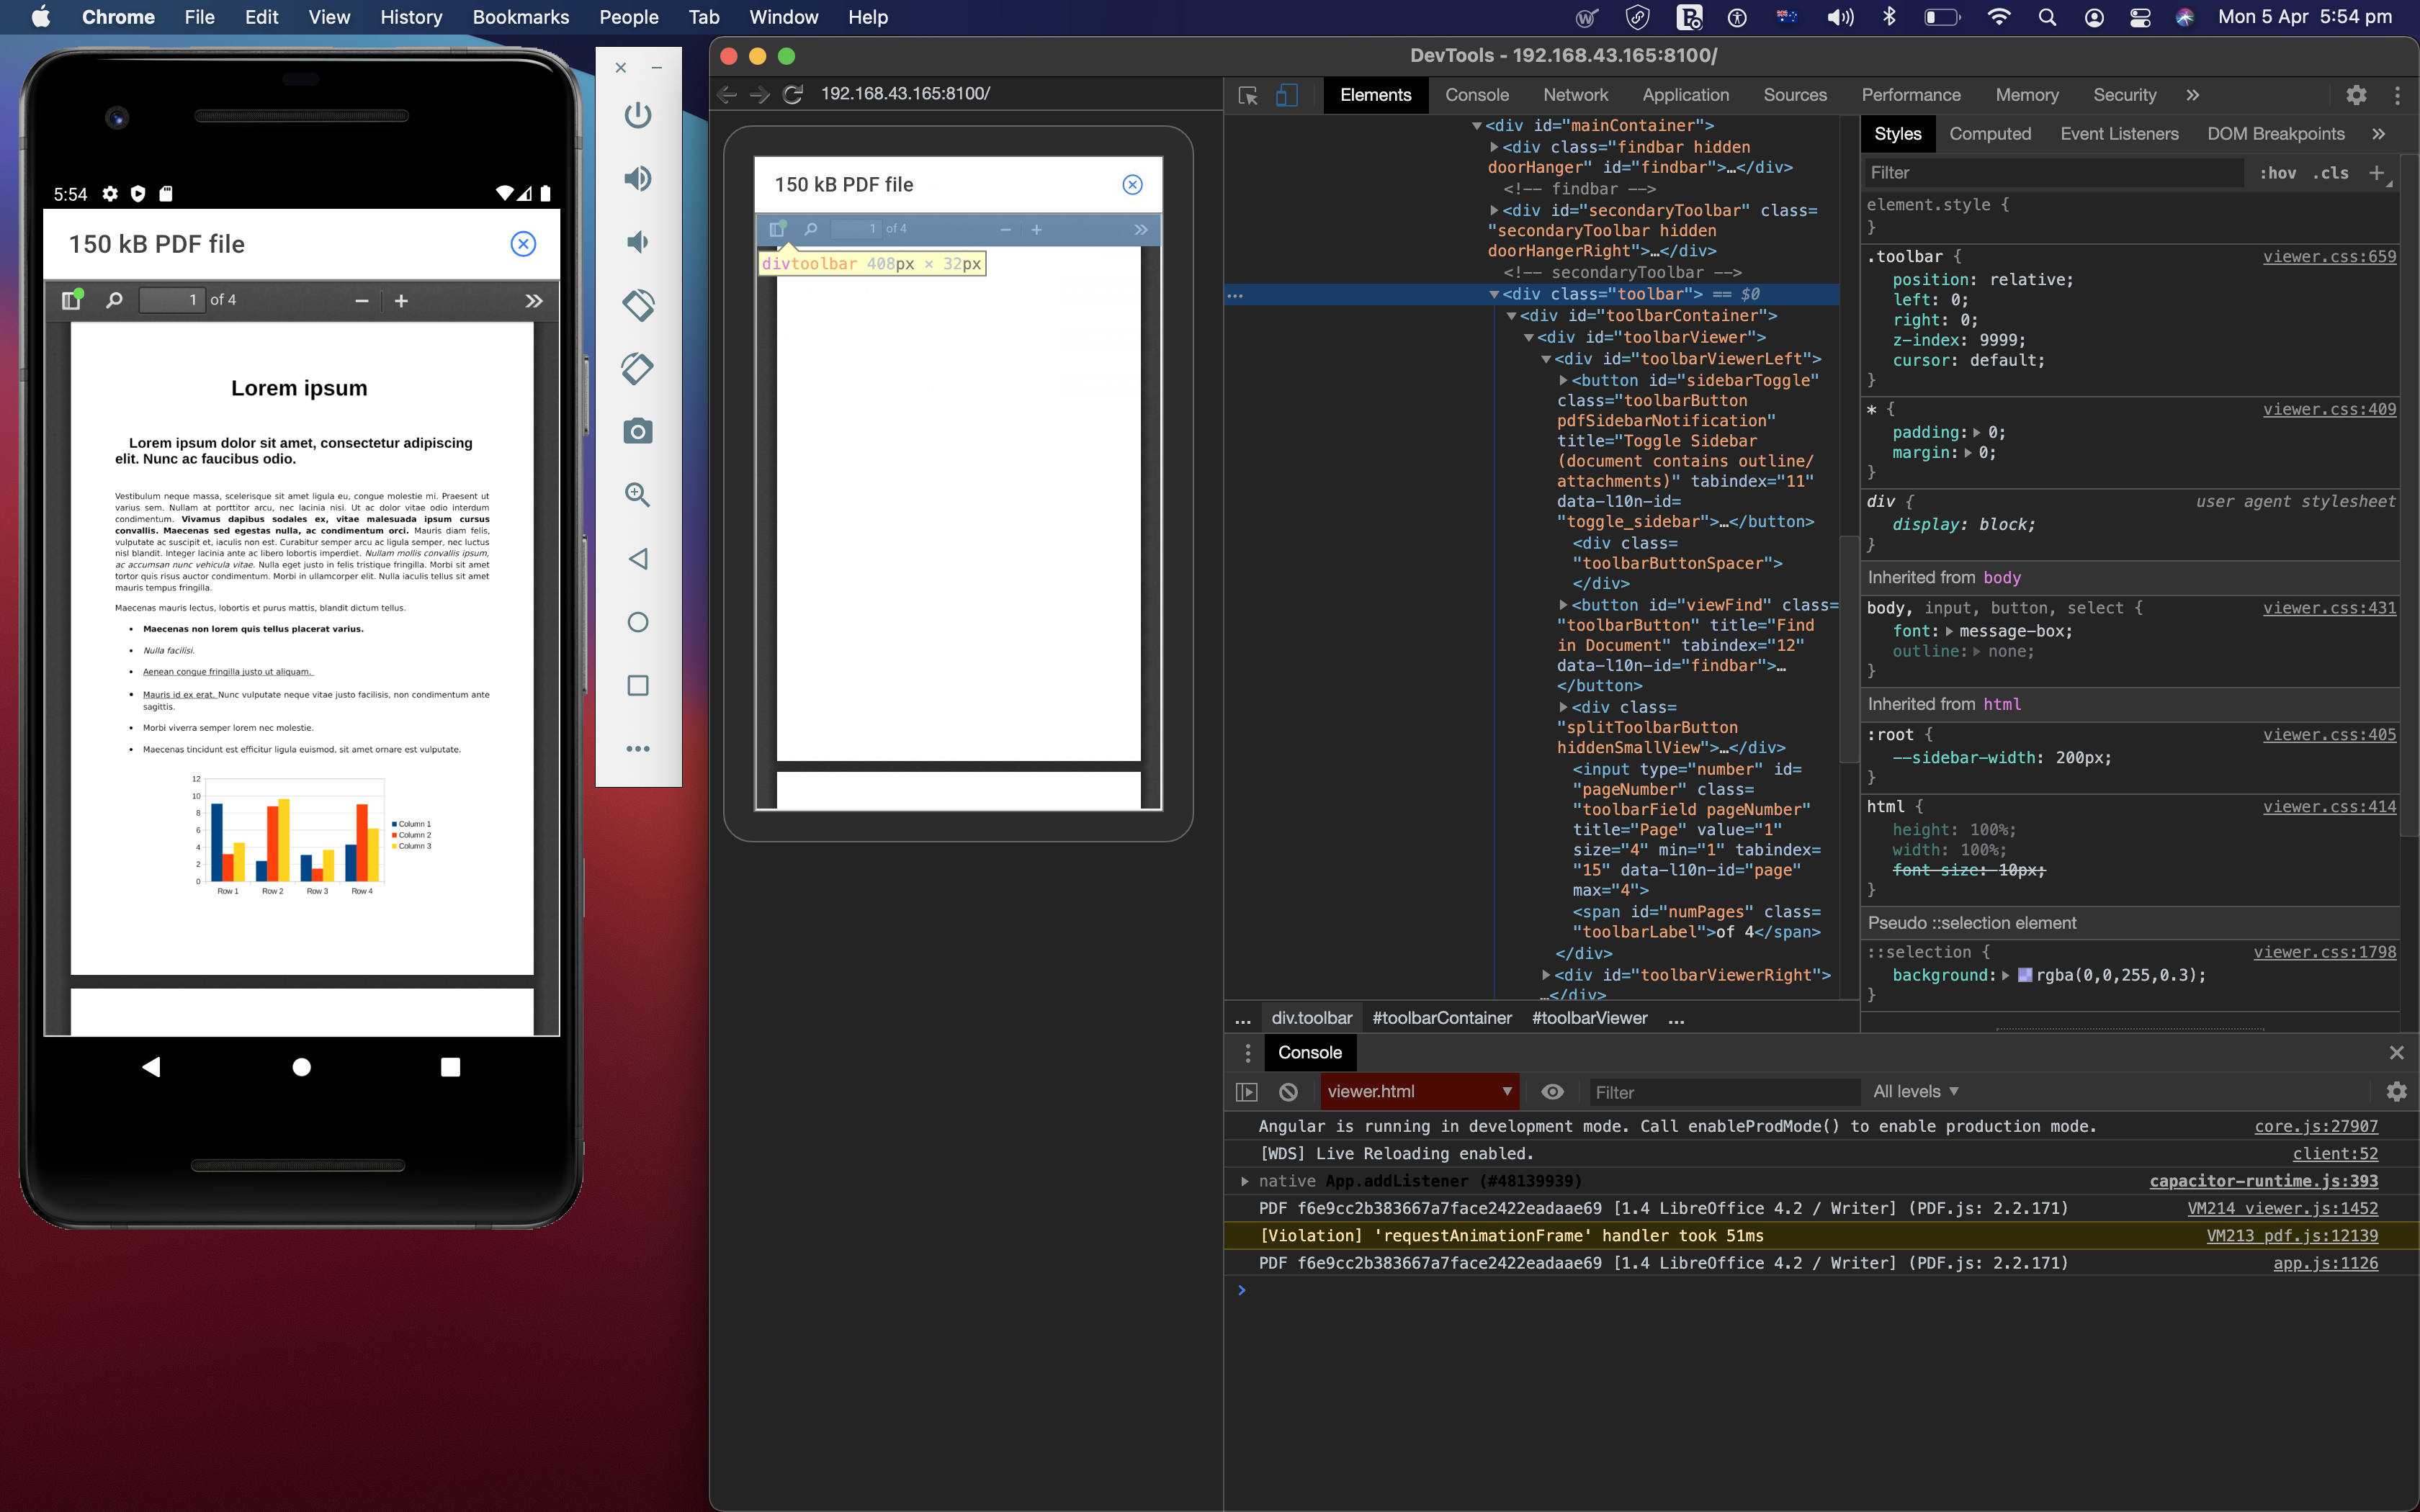 Remote debugging using Chrome DevTools running the app on Android simulator
If you prefer remote debugging using your IDE, VSCode already supports this feature. So instead of putting a debugger in JS or adding console logs, you can simply put a breakpoint in your code in IDE and runtime will pause that your breakpoints. There is a section in the Ionic debugging guide about this method. https://ionicframework.com/docs/troubleshooting/debugging#debugging-with-visual-studio-locally-in-chrome-both-android-ios-
2- Debugging during development using a browser
If you use Ionic with Cordova or Capacitor, some of the native features will be only available when the app runs natively on a device or simulator. This limitation means you cannot simply serve the app using a desktop browser. To avoid this issue, I usually try to wrap my native service calls. Many plugins already provide a web implementation like Geolocation which falls back to use the browser Geolocation API. With other plugins, you can mock the plugin behaviour for the web or wrap the plugin calls in a service/function that ignores the web calls.
The following code is an example of using the Capacitor Haptics plugin on the device and ignoring the call on the web. This way, I will not get errors for the Haptics call in the console if I serve the app in a desktop browser. Alternatively, I could have used the Navigator.vibrate() to replicate the same behaviour, but in this case, I did not have a web target for deployment.
import { Capacitor, HapticsImpactStyle, HapticsNotificationType, Plugins } from '@capacitor/core';
const { Haptics } = Plugins;
export const hapticWarning = () => Capacitor.isNative ? Haptics.notification({ type: HapticsNotificationType.WARNING }) : '';
export const hapticError = () => Capacitor.isNative ? Haptics.notification({ type: HapticsNotificationType.ERROR }) : '';
export const hapticLight = () => Capacitor.isNative ? Haptics.impact({ style: HapticsImpactStyle.Light }) : '';
if (Capacitor.isNative) {
  Haptics.selectionStart();
}
export const hapticSelect = () => Capacitor.isNative ? Haptics.selectionChanged() : '';
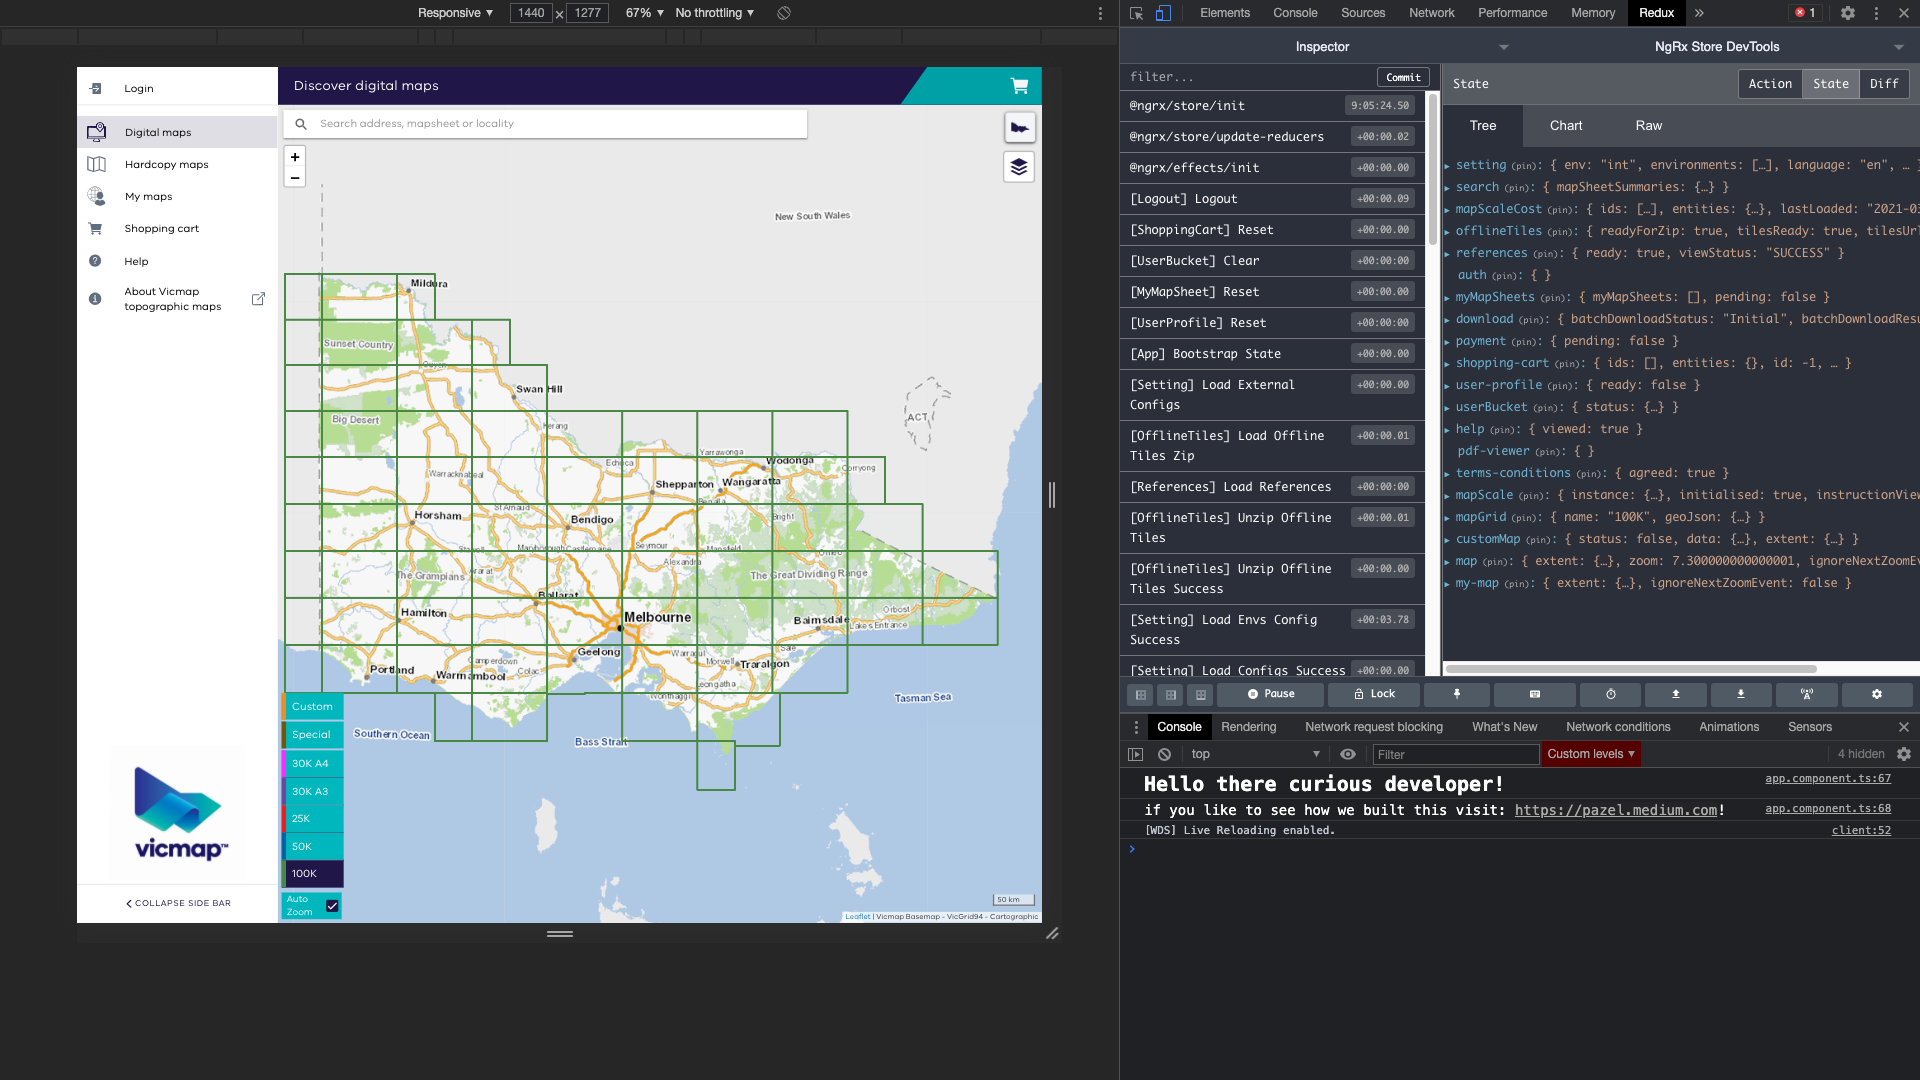
Debugging on a regular browser like chrome helps you to use your favourite debugging tools and extensions. For example, I use redux DevTools to see how my state is changing as I navigate my application workflow. It’s much easier to simulate different screen sizes for testing your UI and the app layout responsiveness using the chrome dev tools. Another benefit of this approach is the faster feedback loop since changes are just a refresh away. Not suitable for debugging that involves native apis access.
Other useful extra tools available compared to remote debugging are the performance audit tab(lighthouse) to test your performance, accessibility, PWA scores, or animation debugger.
Here is an example of debugging an app, which uses ionic v5 and Angular v9.
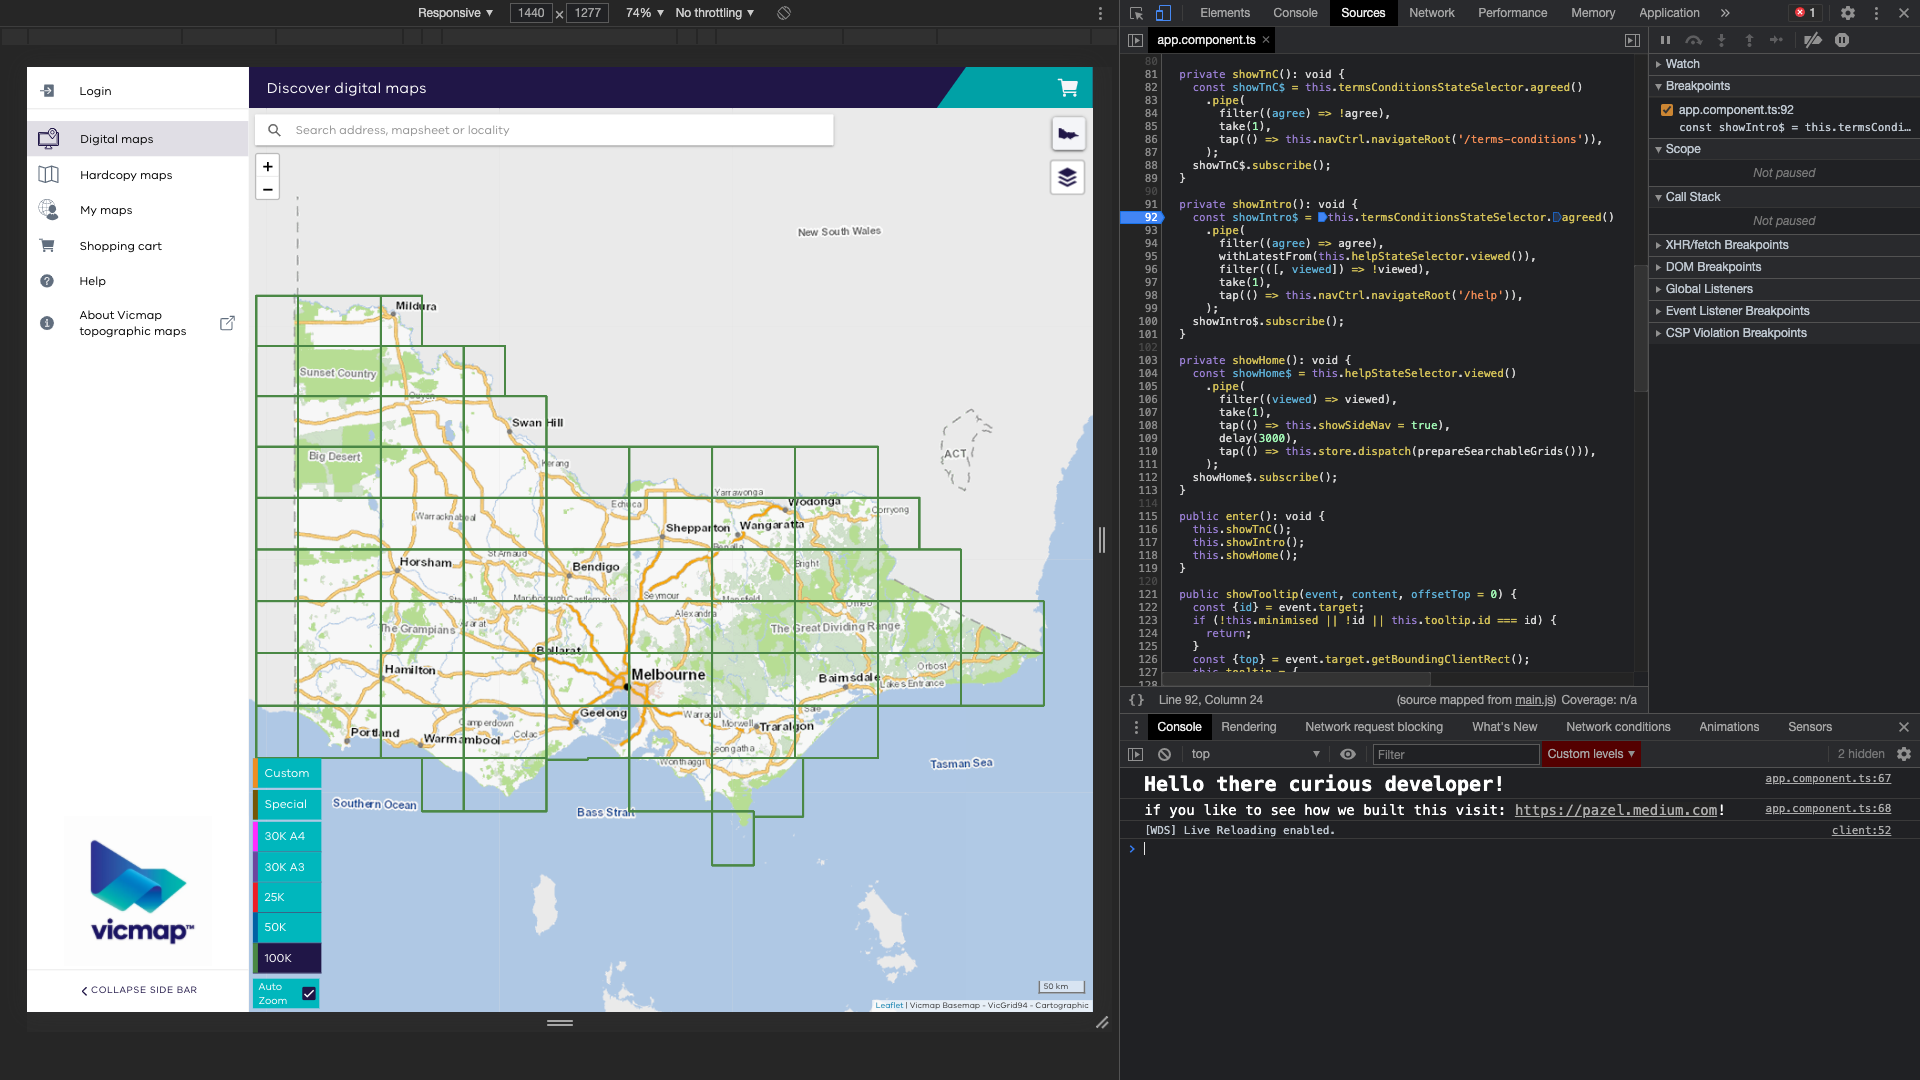
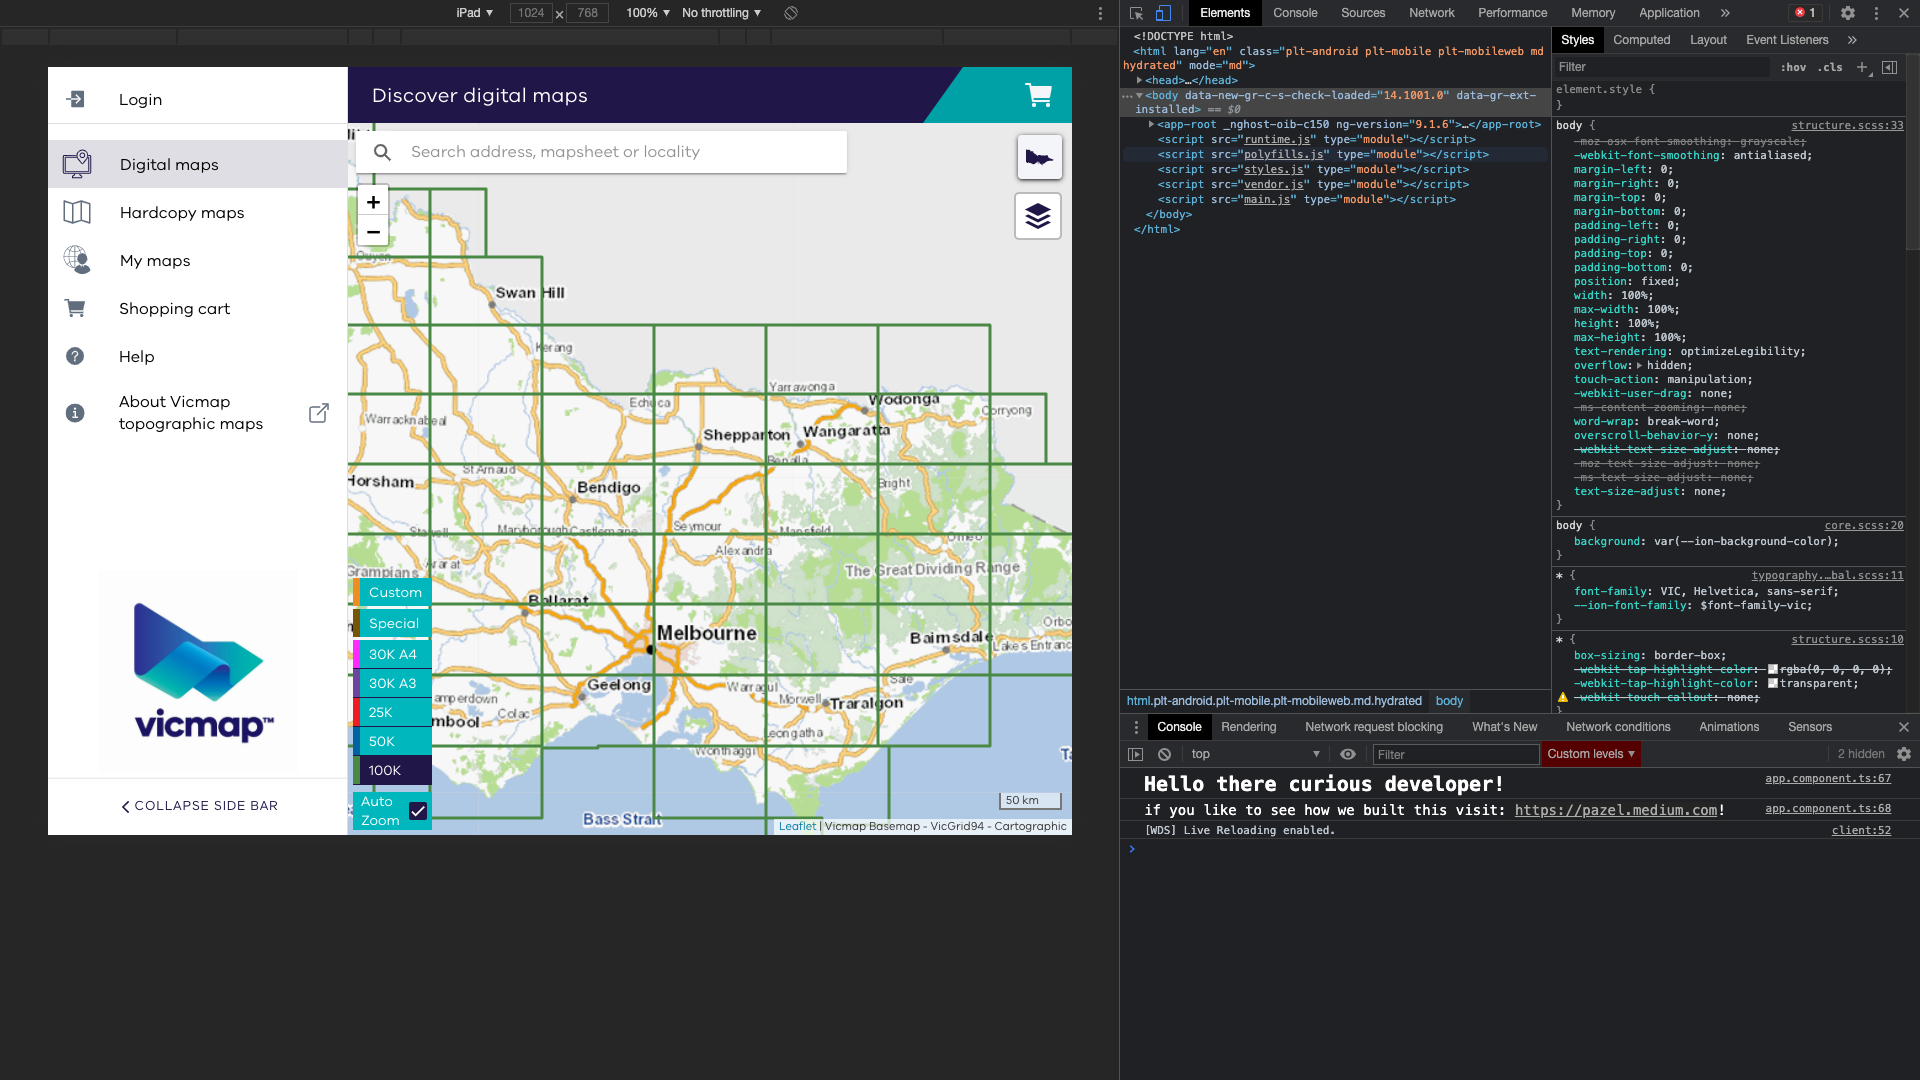
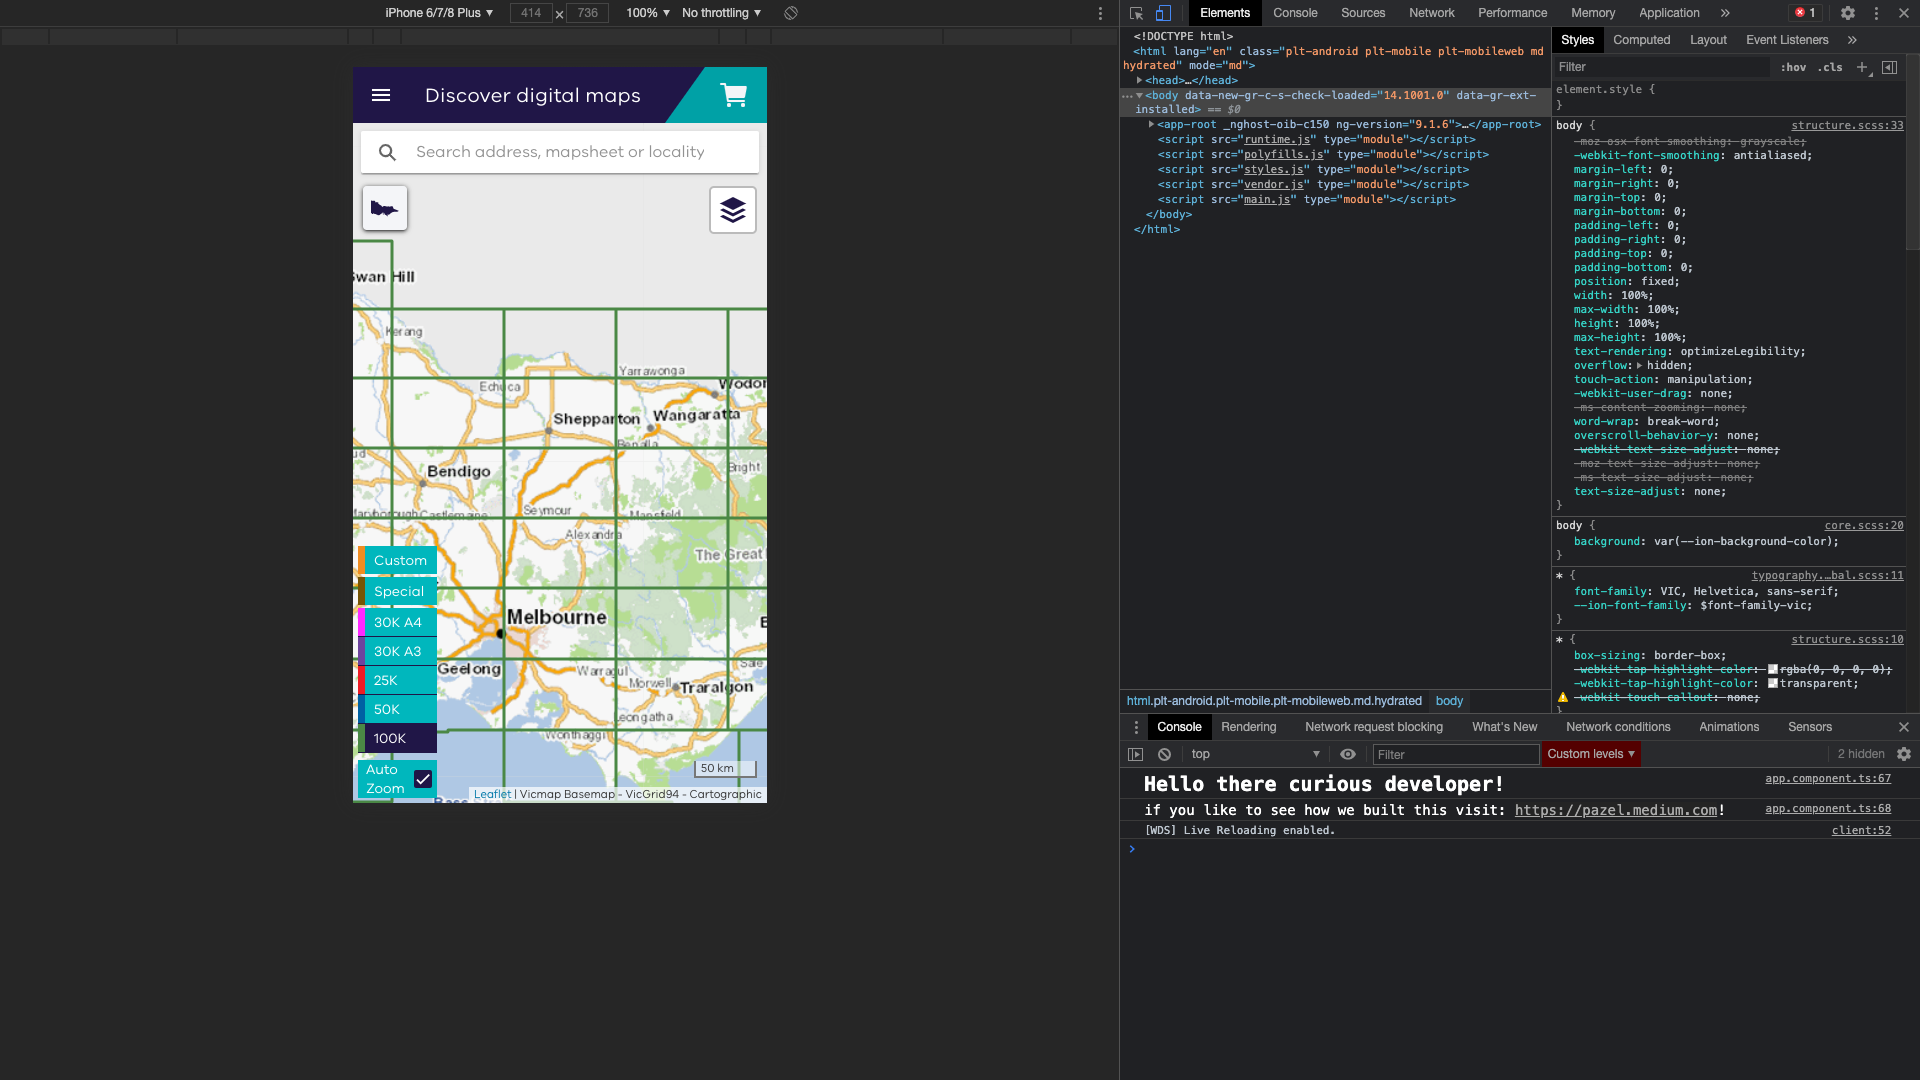
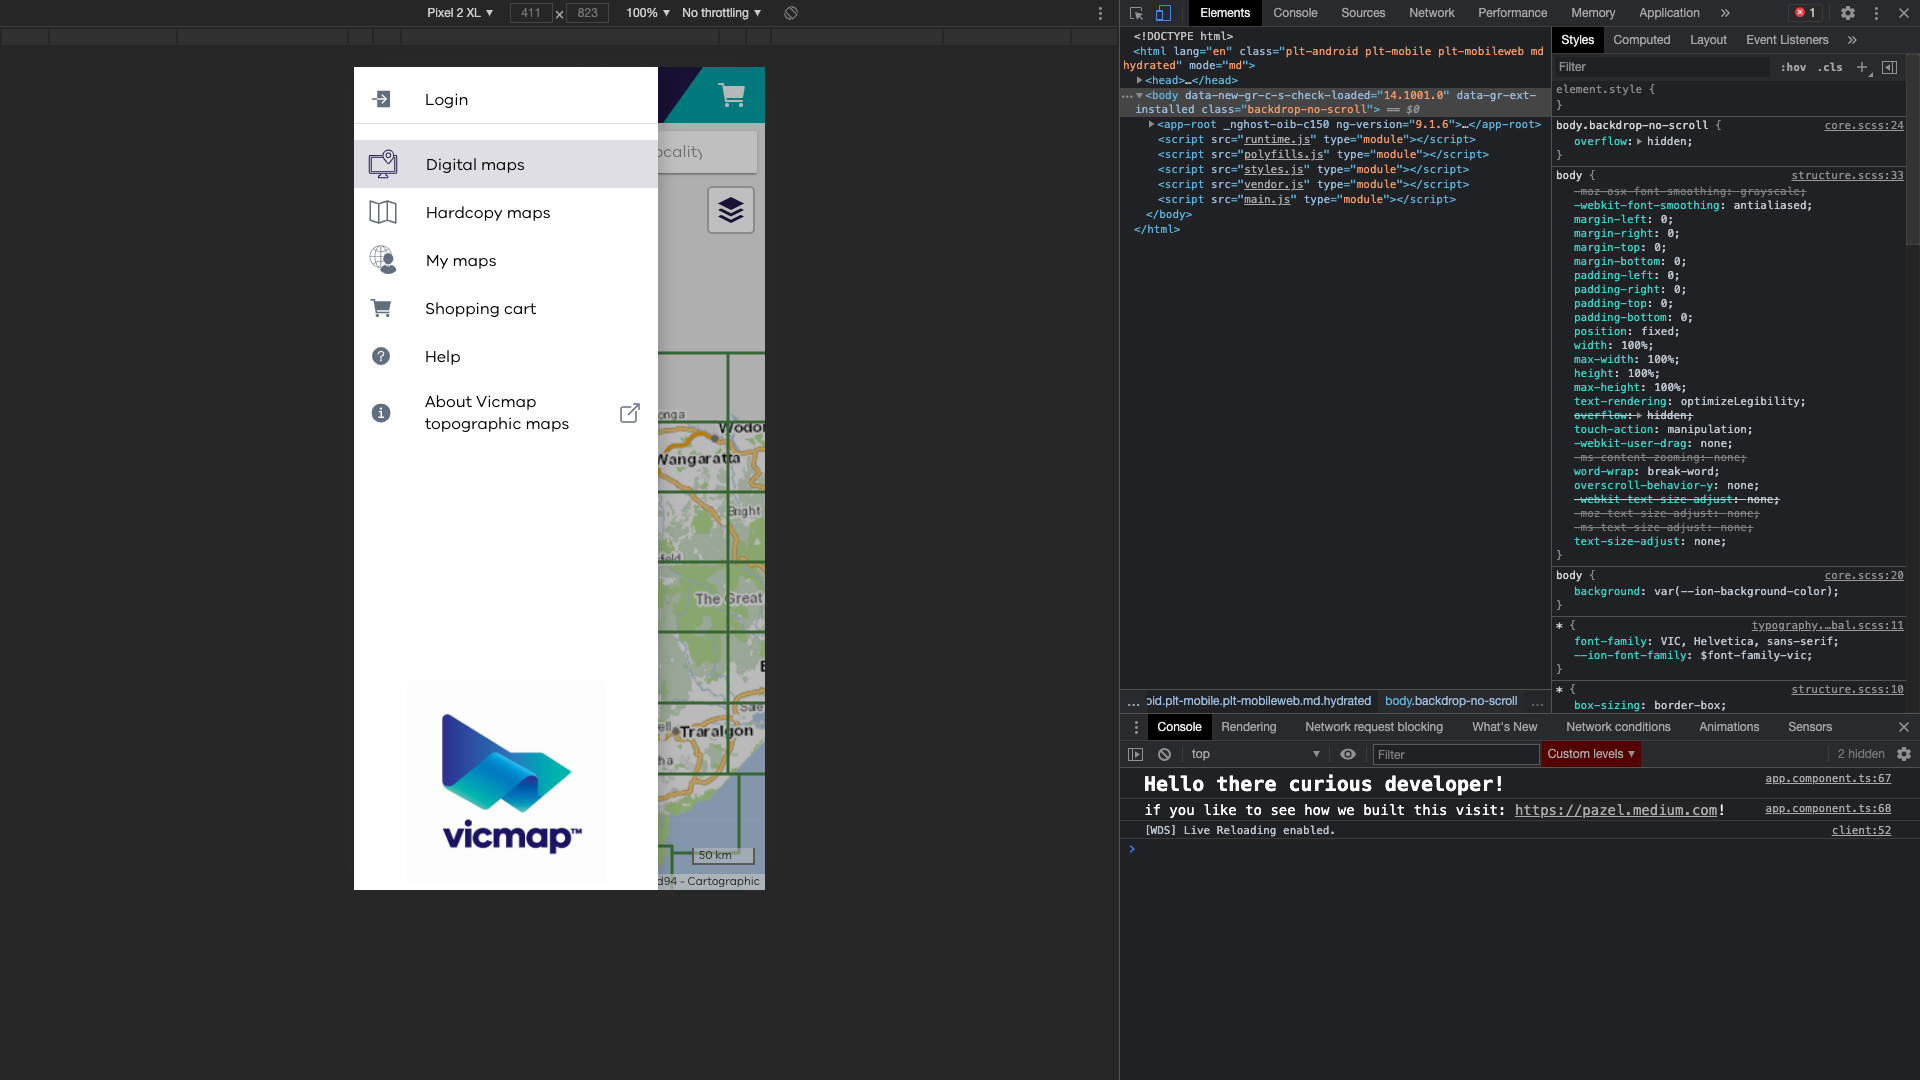 Debugging app layout using Chrome DevTools
3- Debugging during development using native IDEs
If you use Xcode or Android Studio to run your app on an actual device or simulator, you can look at debug logs output in IDE. This method is beneficial to debug issues that happen at the native level. Sometimes these issues happen early on app startup, which means your Web View does not even get a chance to load. So previous methods will not work.
Plus, if you use plugins to access native capabilities, you can quickly put a breakpoint in the Swift (Objective C) or Java code to find out issues caused by a bug in that plugin.
Running the app using native IDE’s is the primary way Ionic & Capacitor works. With Ionic & Cordova, you will need to go to generated iOS or Android project and open it in the respected IDE to debug it.
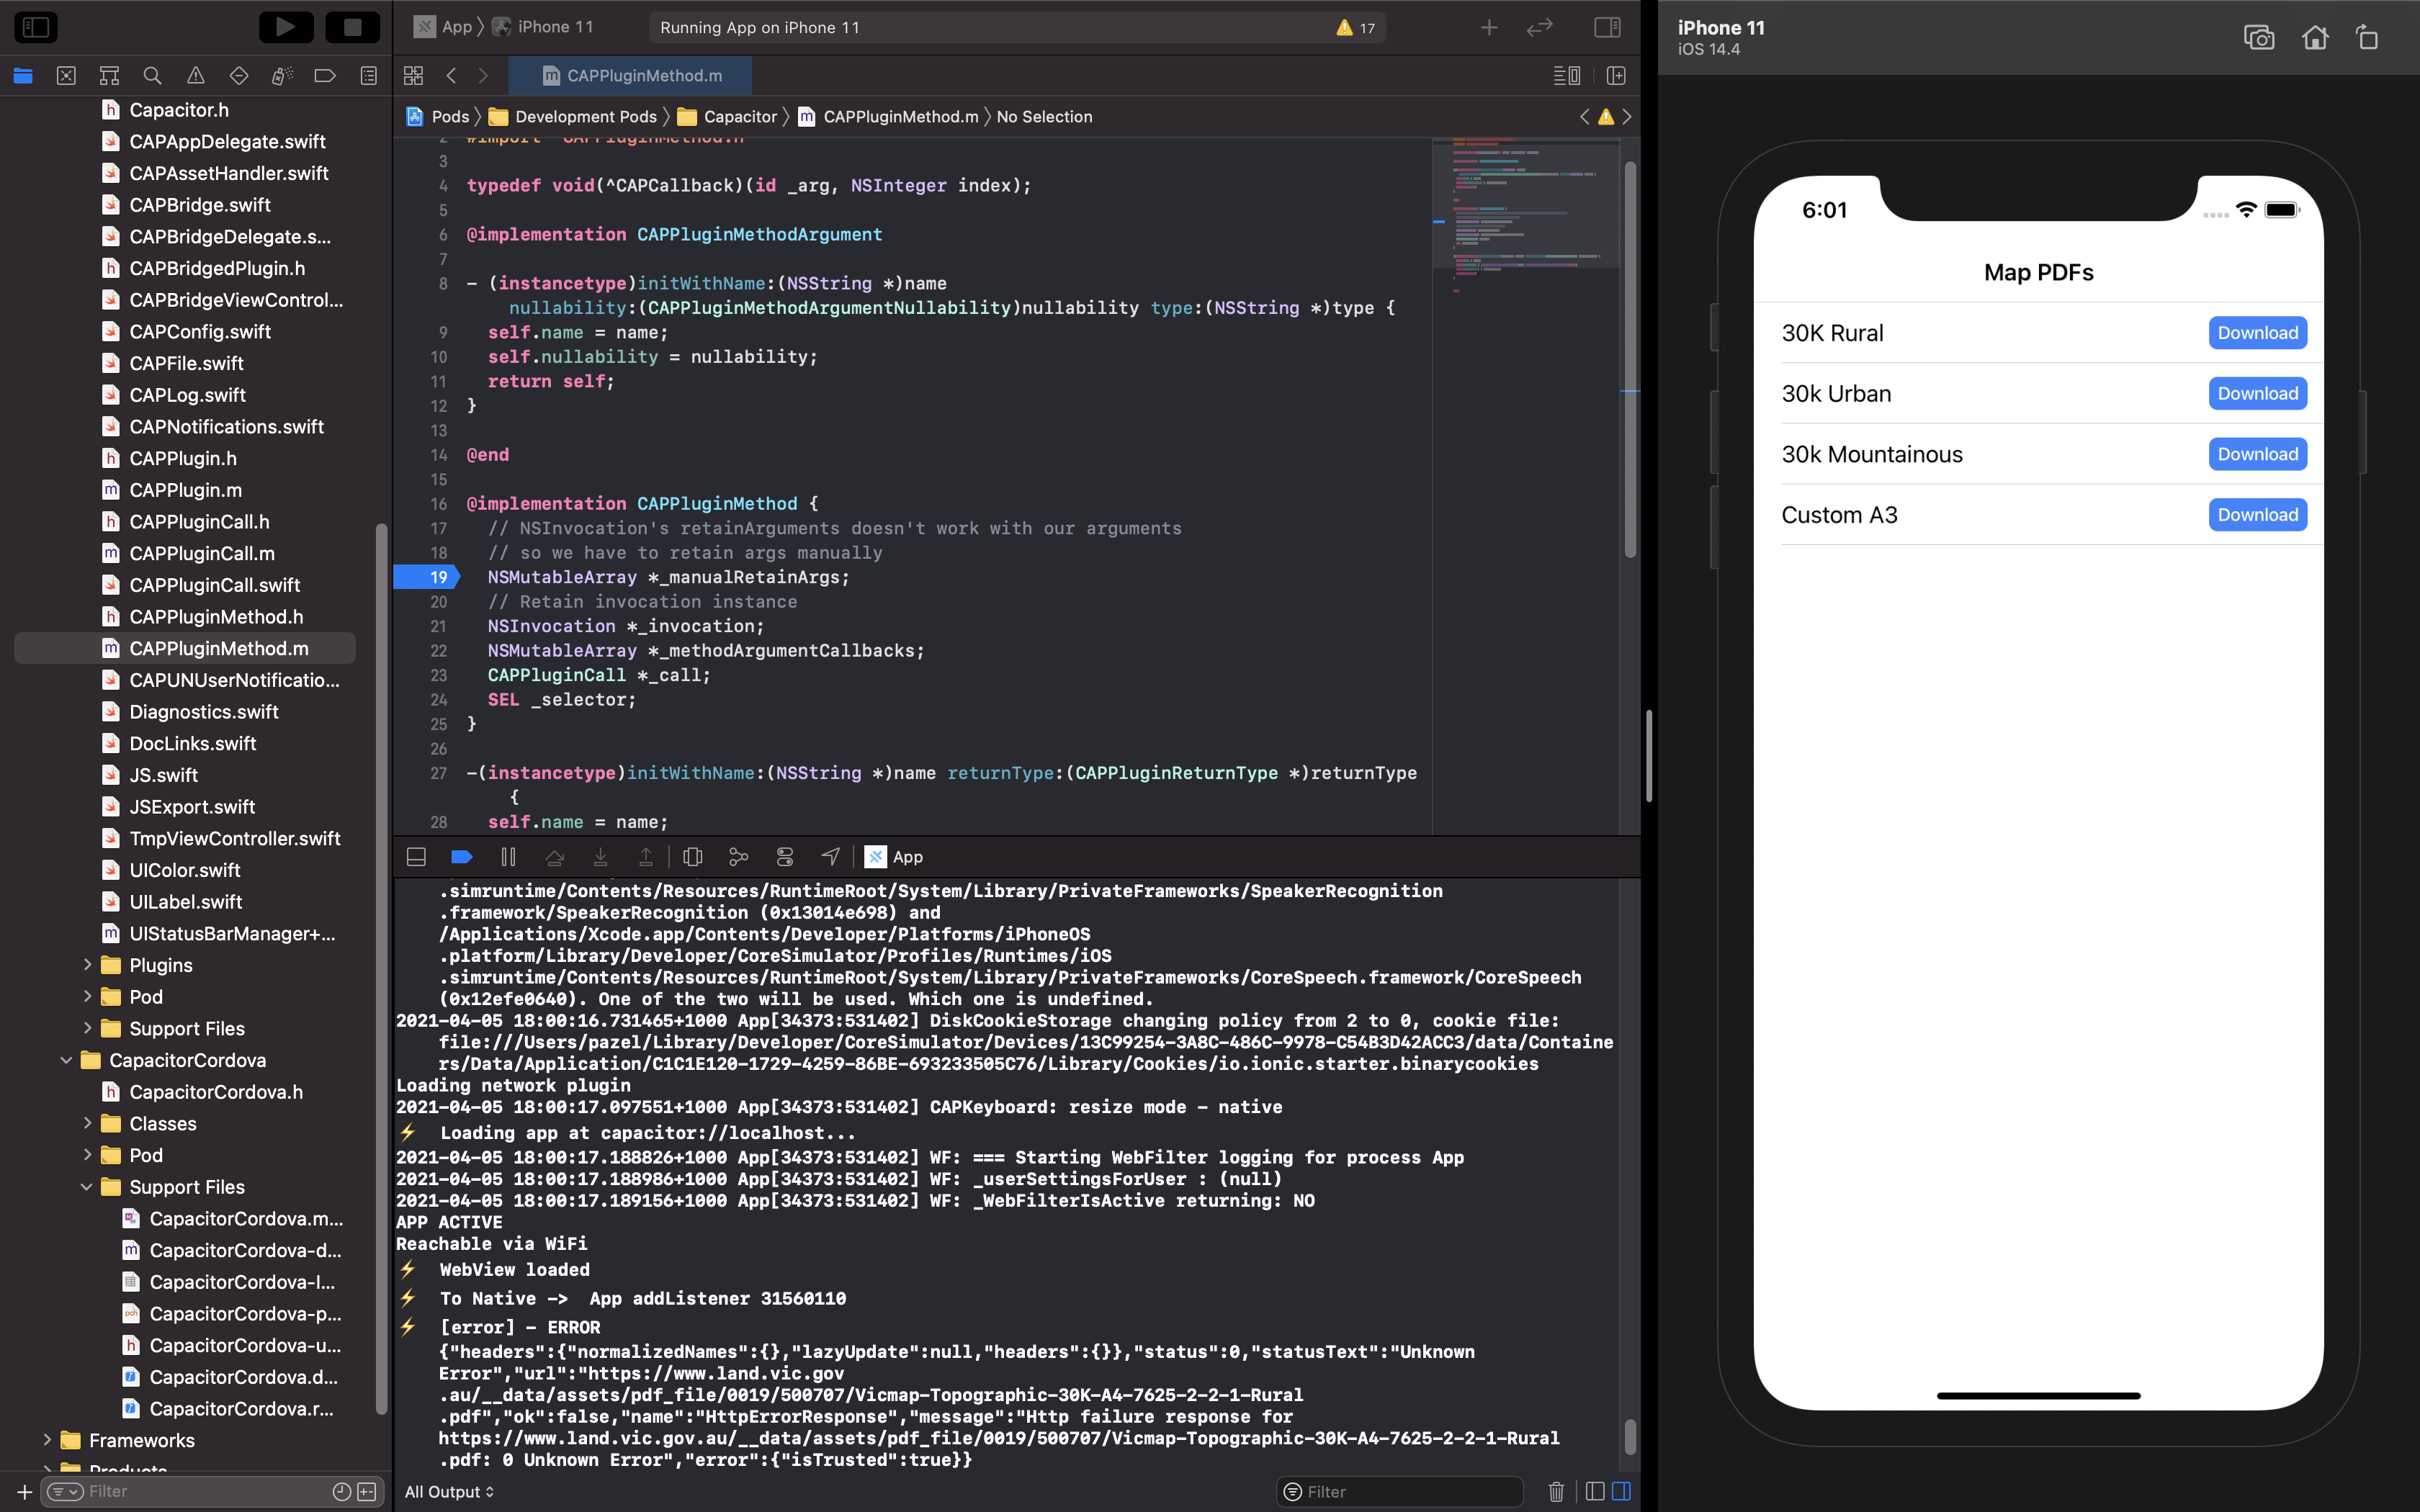 Debugging using Xcode
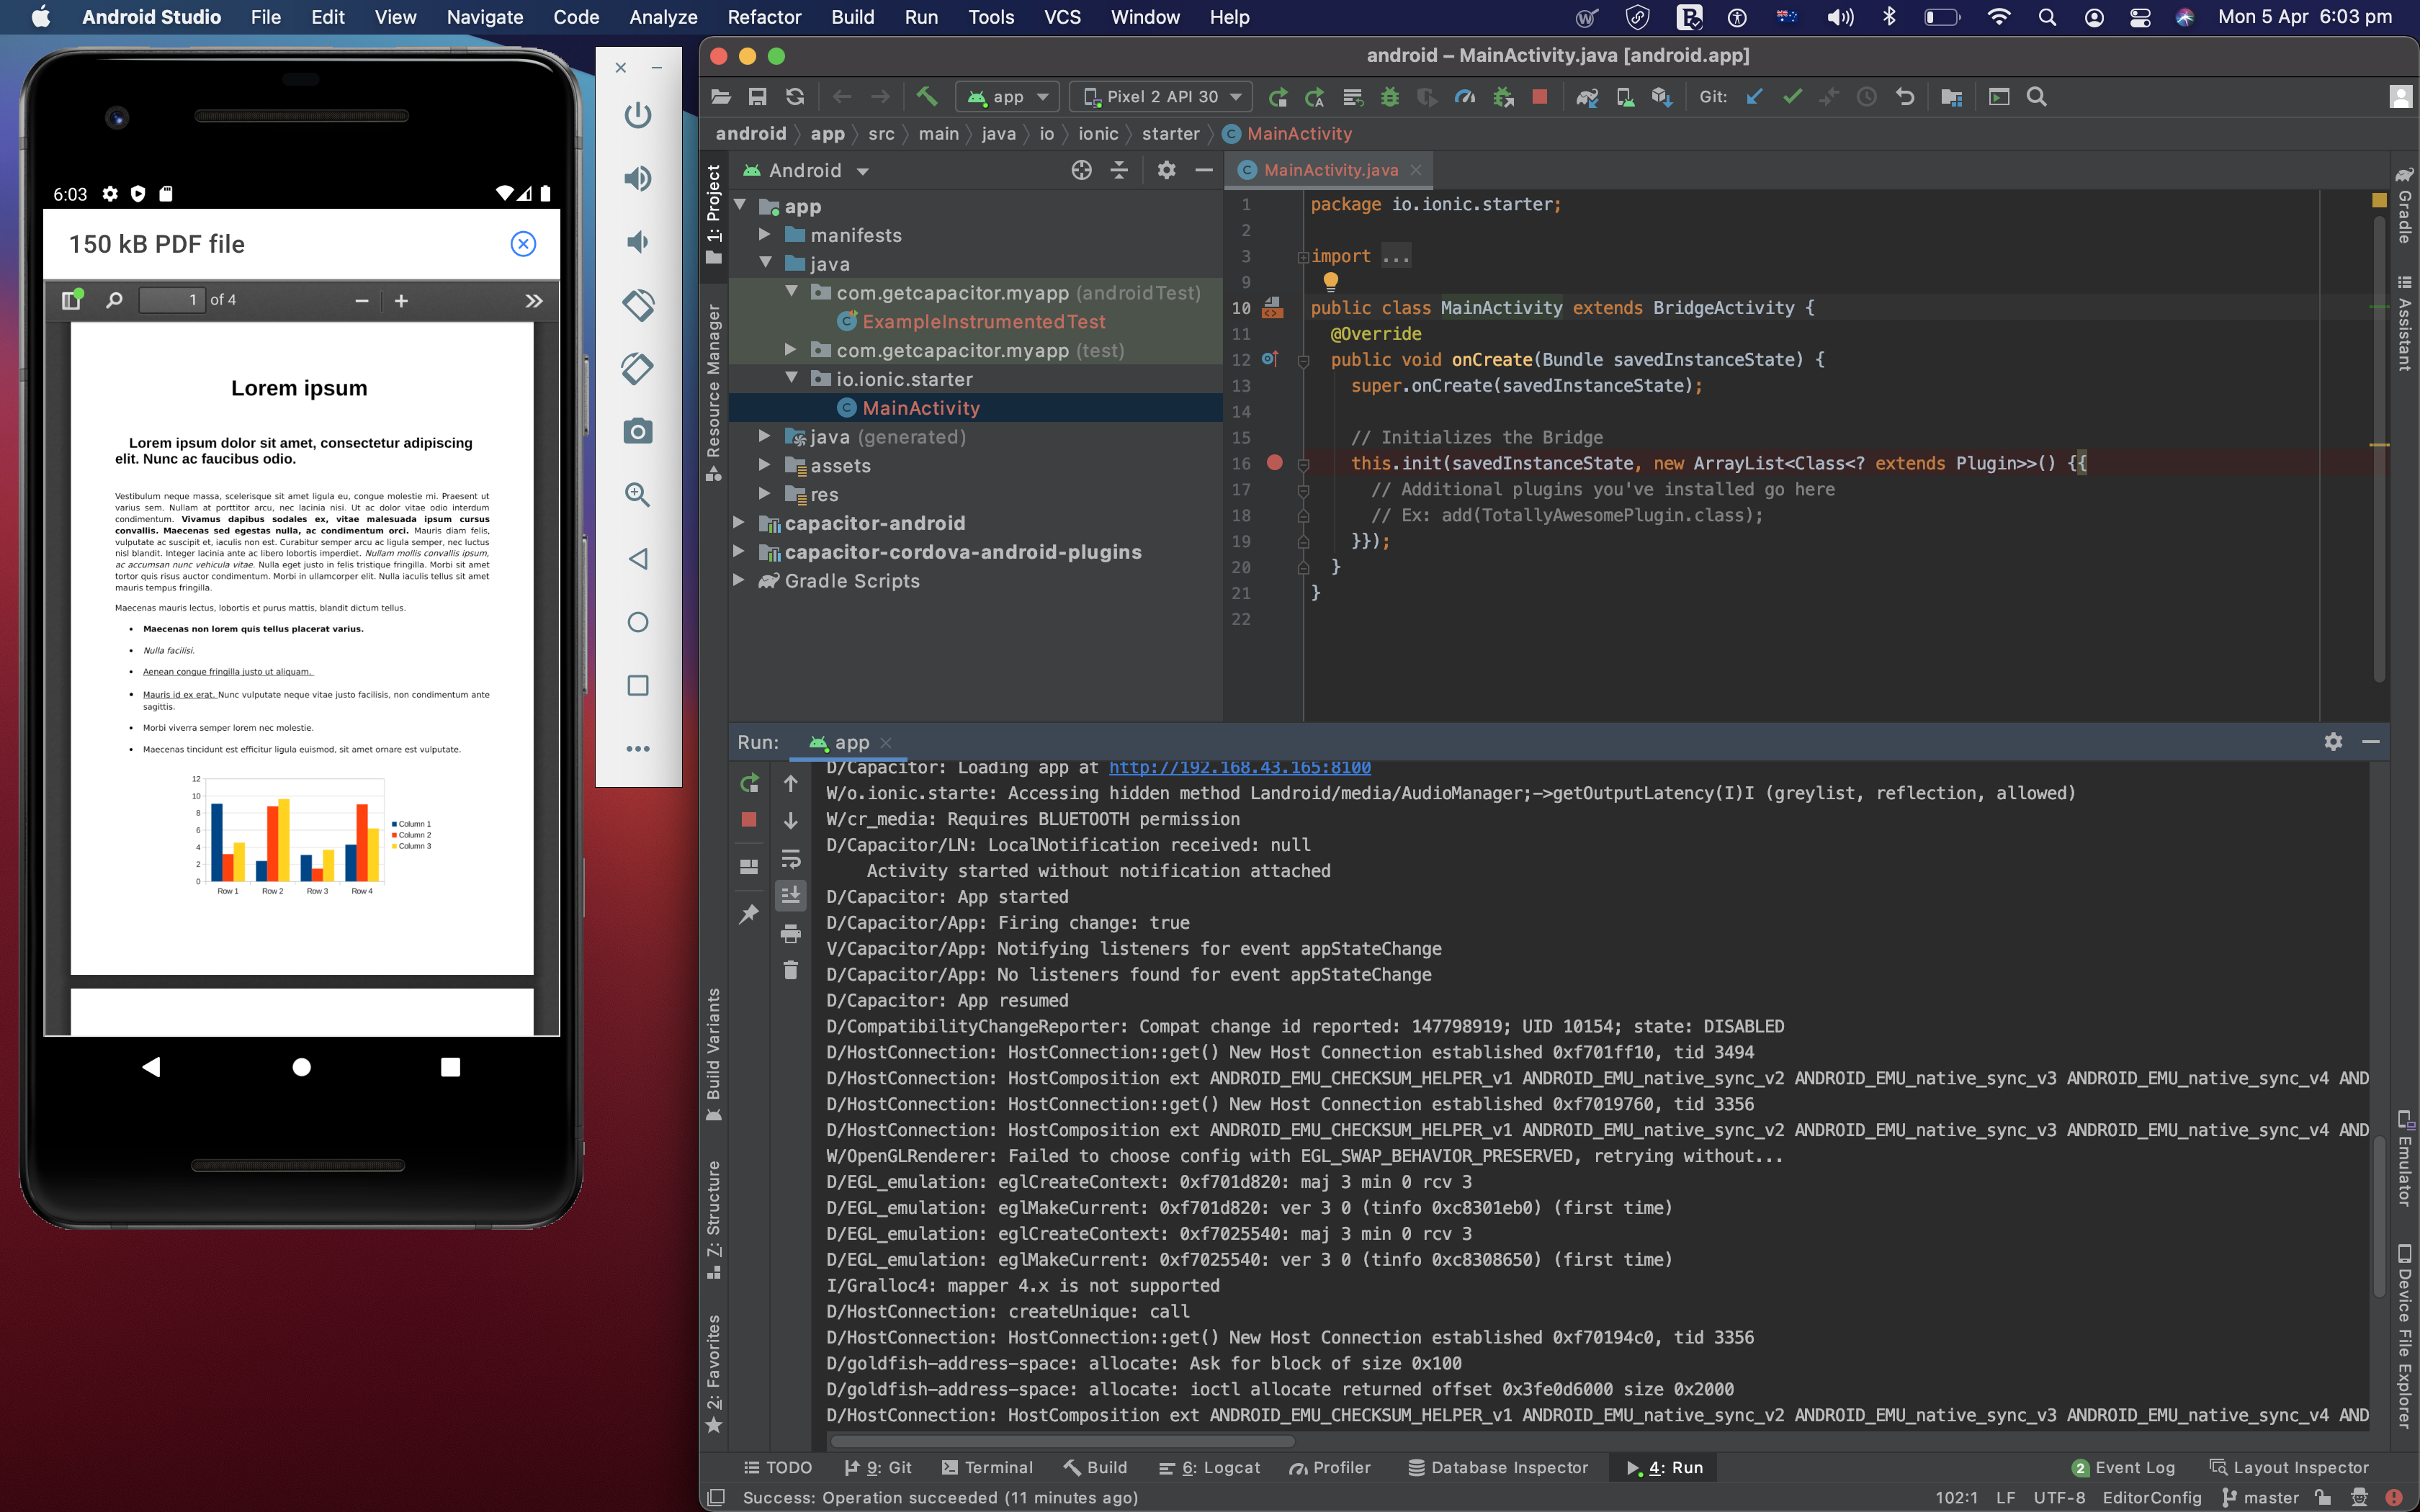 Debugging using Android Studio
There are many more tools for debugging. For example, using the desktop browser or native simulators, you throttle the network to simulate intermittent network condition or mock GPS location for debugging related to a device moving on a path or at a certain speed.
I hope you have enjoyed reading through this article, and please check part two of this article.
Please leave a comment if you have questions or need help with some specific topic in the Ionic apps debugging.