How to Debug Ionic Mobile Apps in Production
This article is the second part of a two-part article on how to debug ionic apps. The techniques described here are helpful if your app is in release mode. If you are looking for ways to debug an app during development(debug version), please look at the first part of this article.
The downside of all the methods I explained in the first part of this article is that they are only available as long as the app is in debug mode (not the release version).
When you sign the app for Release, the app cannot be debugged using remote debugging anymore or using the Native IDE. So You need an alternative way to see your application logs. Let’s explore some of the options.
1. Use device logs
This method is not my favourite, but it can be handy sometimes to look at the device logs. You can connect your iOS or Android device to a computer to see the logs written to the console by all applications.
It’s not the friendliest debugging experience, but sometimes it is a good option since some of the issues can be at the OS level and not related to code, so WebView might not be much of help.
If you go down this path, you need to learn how to filter the logs to see the logs related to your application. You can use your app bundle id or some specific keywords to filter the logs and see your application logs. Still, this will be a very low-level debugging experience compared to the experience you can get from Chrome DevTools.
Here is an example of Android debug logs by running the adb logcat command.
Tip: use a consistent structure in your application logs. This way, you can always use grep to filter the device logs. Here I am usingadb logcat grep | 'File manager' to get all logs starting with that keyword.
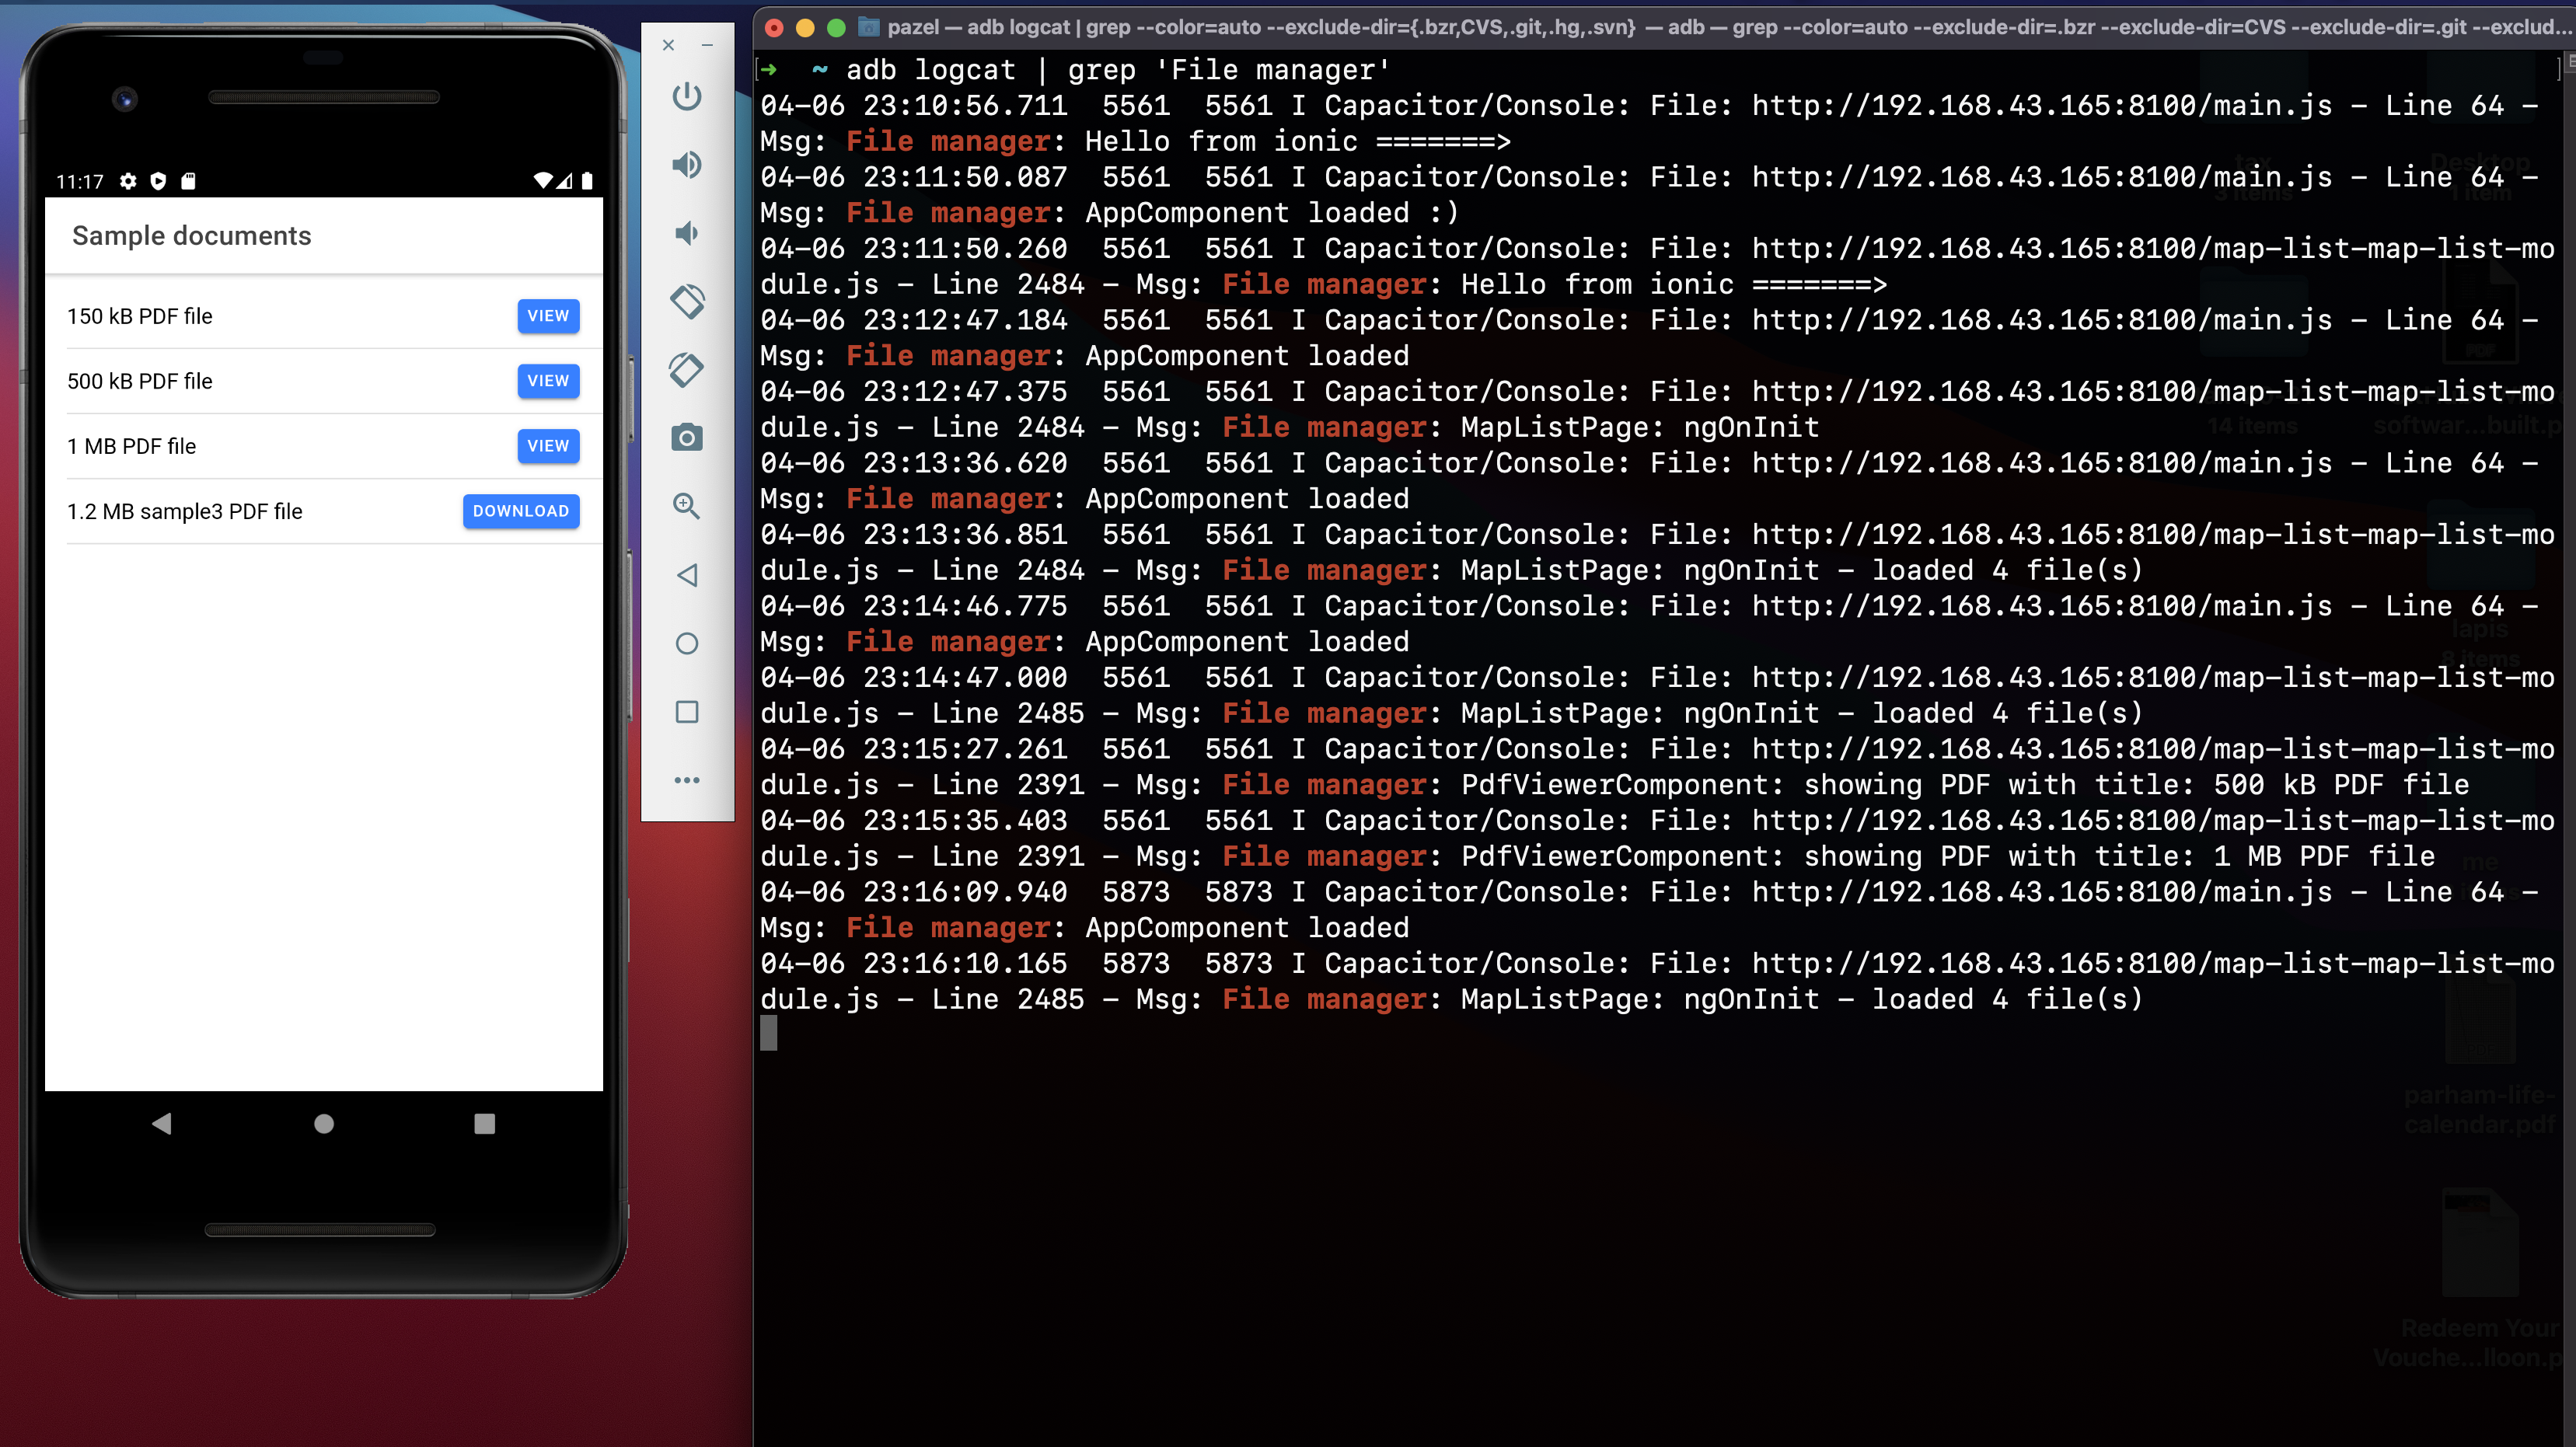
Viewing Android debug logs using adb logcat
If you decide to go down this path, you should use Android Studio since looking at adb logs is not much helpful. This way, you can set the log level as you wish and filter by relevant keywords you know, like your bundle id.
Here is an example of adb logs for the Spotify app with bundle id com.spotify.music. To access the logs open Android Studio, click the logcat in the bottom toolbar and then in the logcat window, select your device and provide the filtering options and log level(info, error).
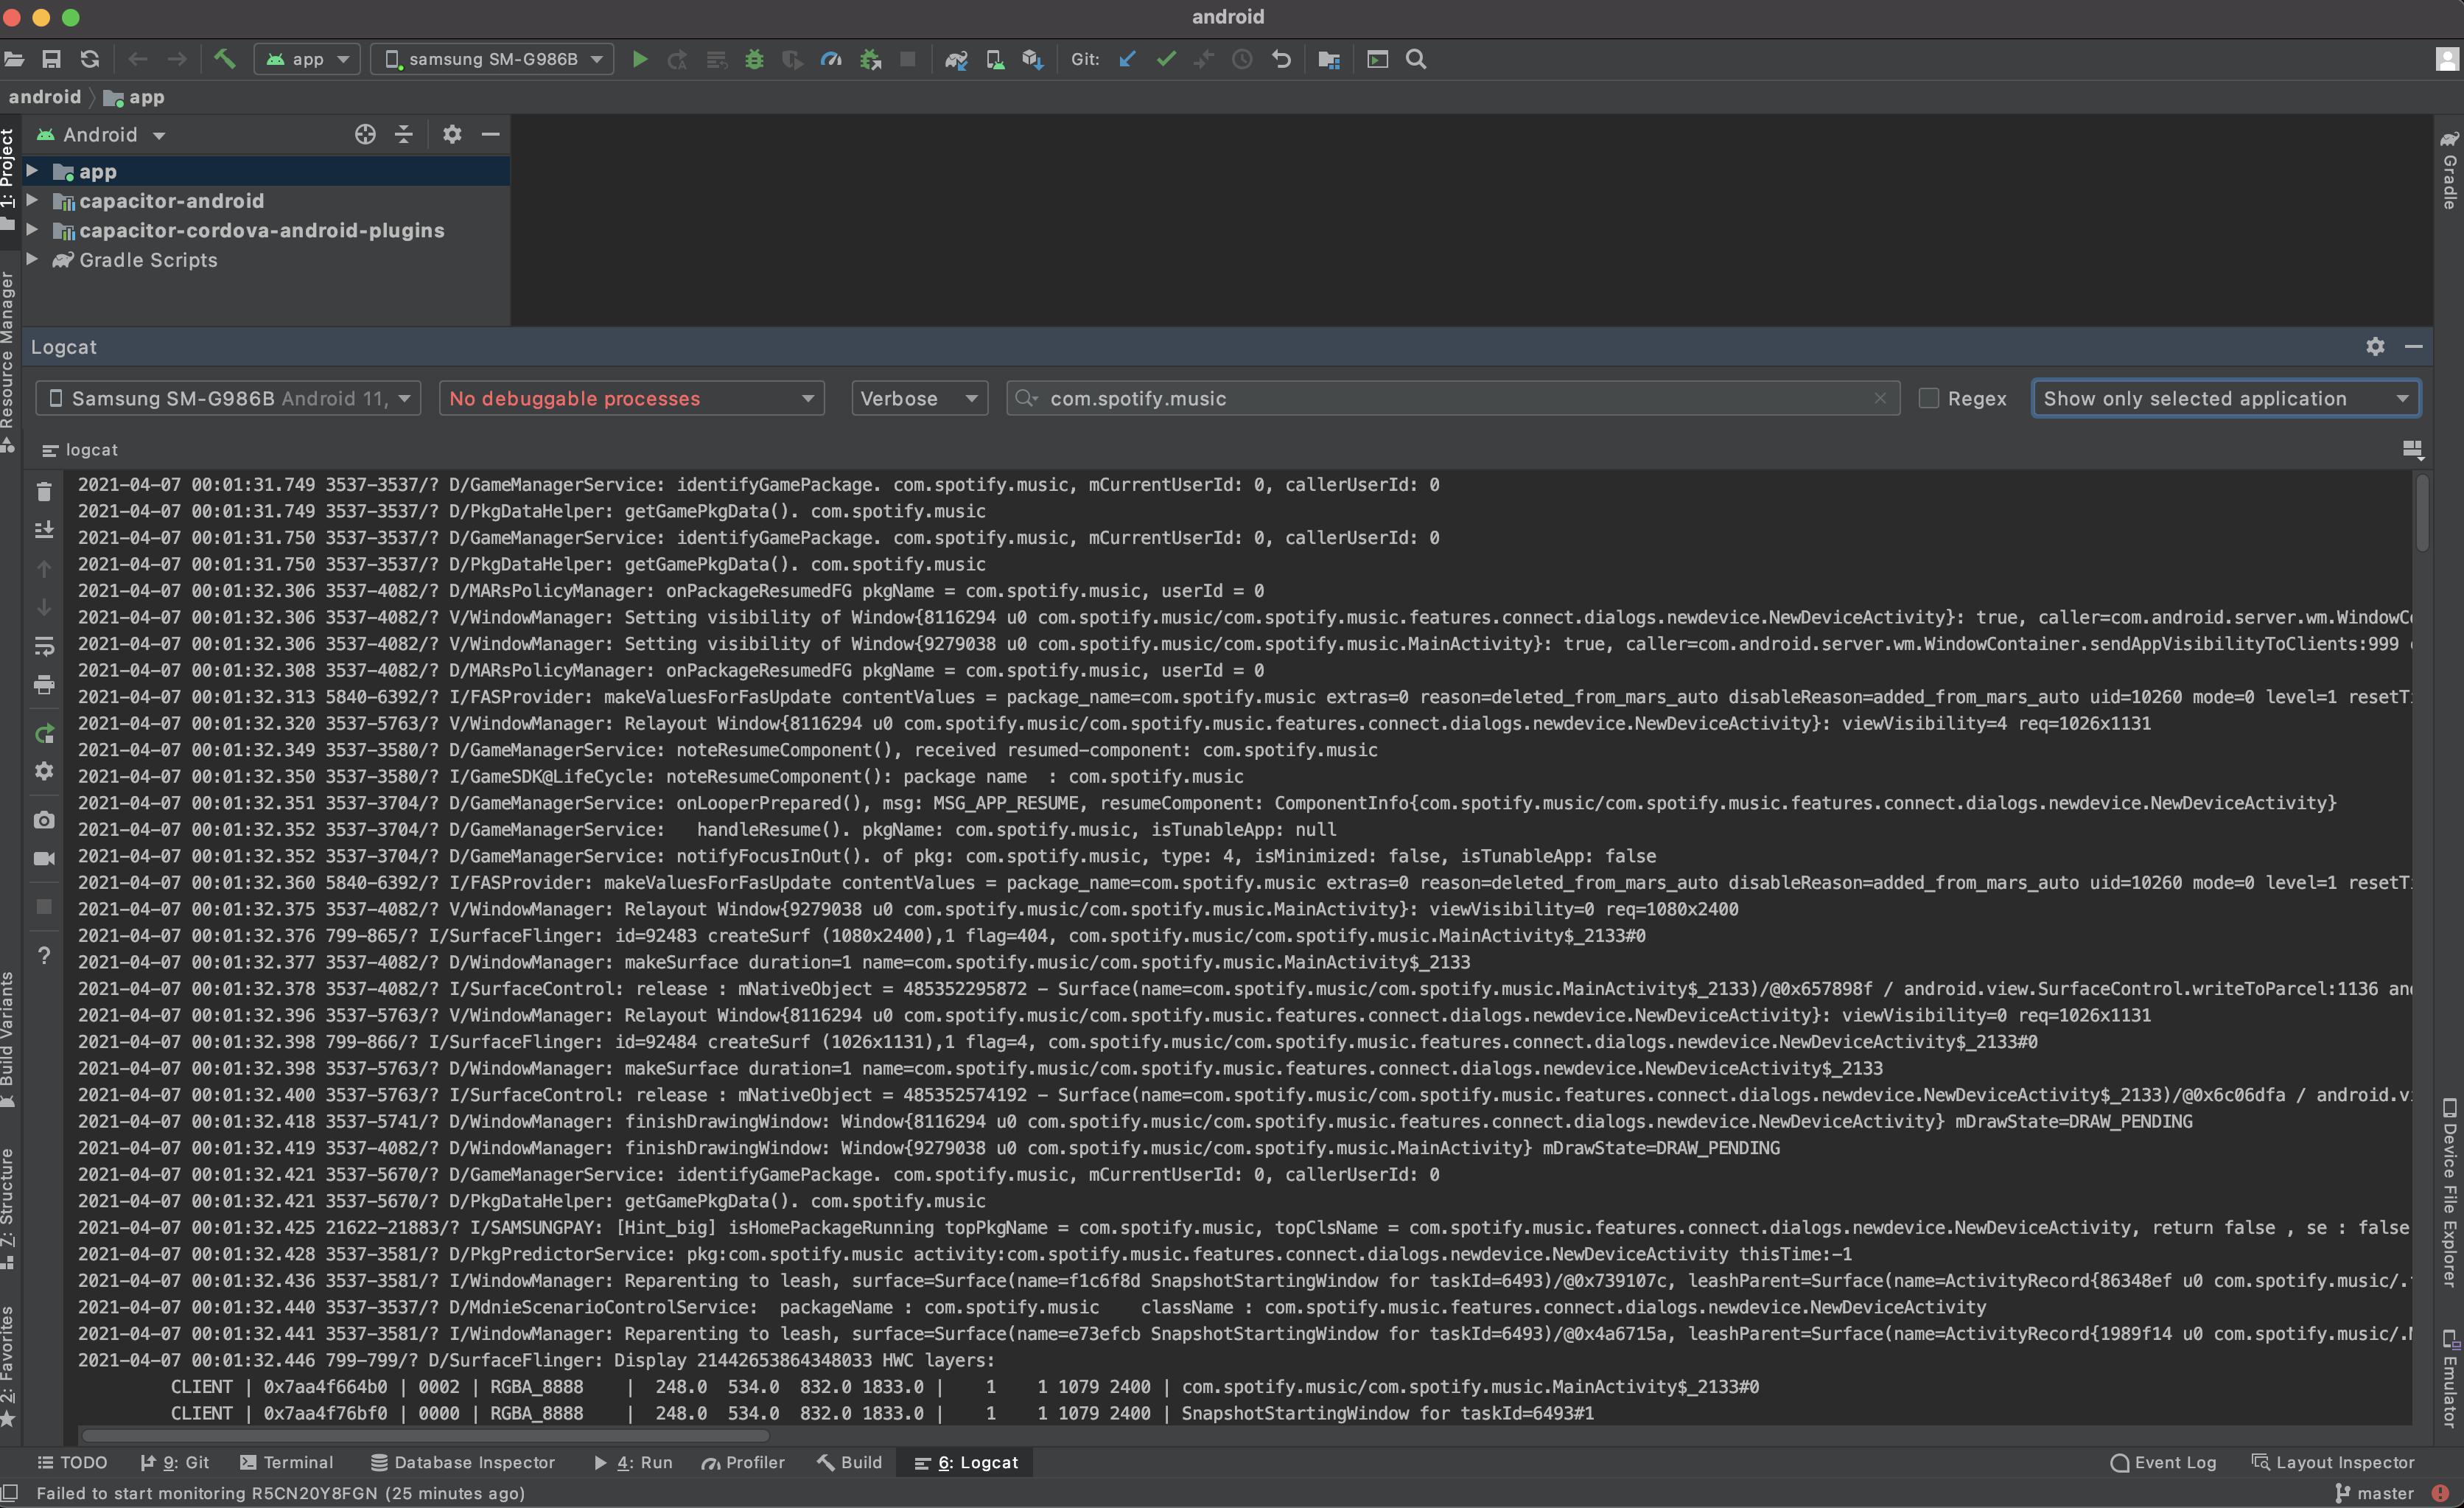
Viewing Android debug logs using adb logcat in Android studio.
Here is an example of iOS debug logs using Xcode. You will get a lot of logs, but you can filter by application. The nice thing is that you can access crash logs to give you an insight into why the app is crashing. To access these logs, open Xcode, then go to window menu and select Device and Simulators (or use cmd+shit+2 as shortcut) and select your device or simulator from the list to see its related logs.
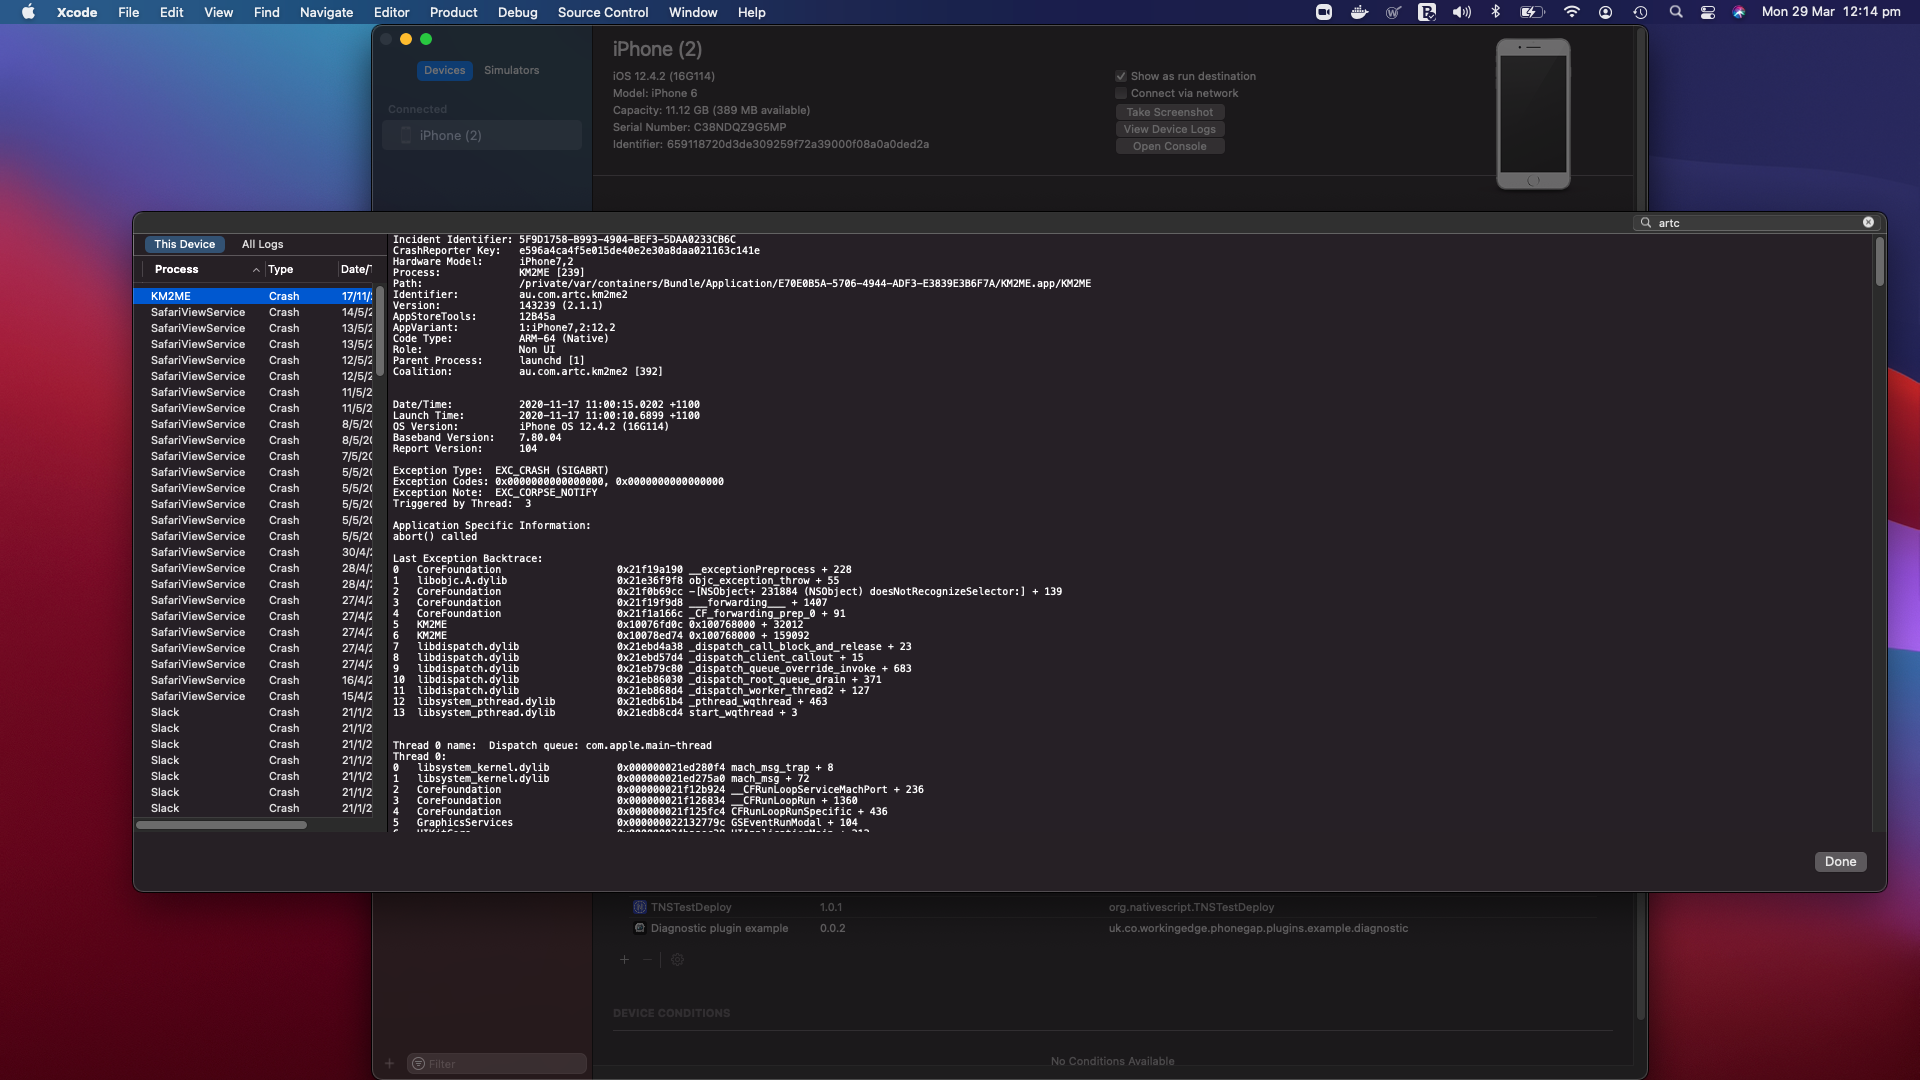
Looking at device logs from the prod app using Xcode
Some other limitations are that you need access to the device. This can be problematic since your mobile app is distributed to an extensive range of Android and iOS devices that you do not physically have access to them.
Usually, when an issue happens in production, you have no clue until an upset customer reaches out and tells you about it.
Even then, replicating the issue might be very difficult considering all the environment settings you may need. (OS version, Device model, Runtime issue related to lack of resources like memory or storage on the user device and bad network issues, to name a few.)
All you will get is that your app doesn’t work! If you are lucky and dealing with an experienced user, you may get some more details on the workflow leading to the issue. I think you agree that this sort of debugging is very inefficient, and you can go forth and back with the user many times to pinpoint the issue.
2. Create an on-screen logger
This method is very similar to the previous solution but a little easier to access the logs. Instead of connecting the device to a computer and looking at runtime logs, you can show a human-readable version of all the logs on a debug page in your app. This method is helpful, especially during internal QA when the app is tested as a proper release version by your own QA in-house. Here is an example of the on-screen logger in one of our older Ionic app, which uses AngularJS. These logs are categorised for easy access to errors and have a specific format.
It might not look obvious at first, but in the hands of an experienced dev who knows the app’s workflow, this is good information for debugging.
Also, the user can send a copy of logs by sending the dump file to an API or email address.


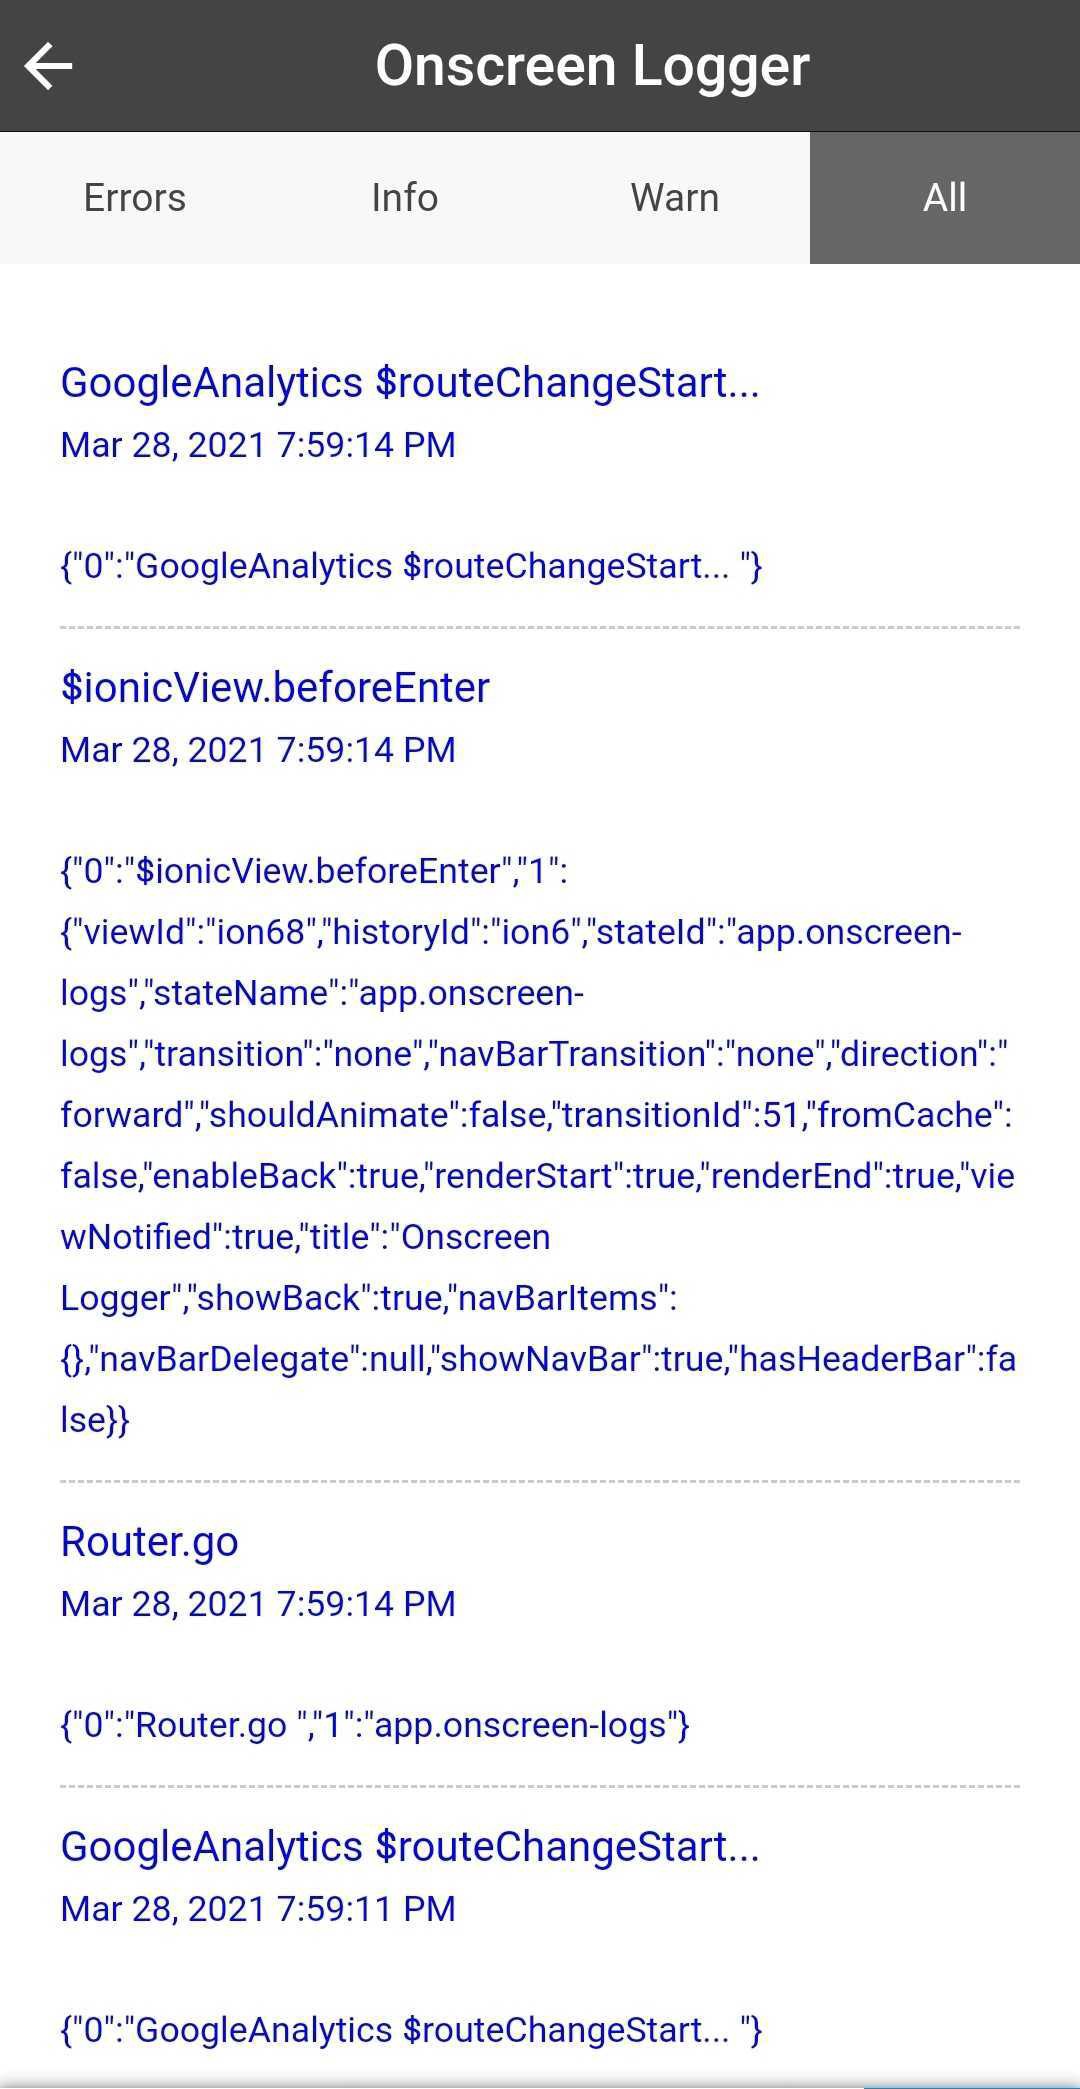
On-screen debugger page showing application logs
The easiest way to implement this is to override the console methods and add logs to an array so you can print them on your page.
Even this method has its limitations. You can only write a limited number of logs on the screen, which is not easy to read through or search. Also, you cannot keep too many logs on the device since it can turn into a large file quickly. So look at it as an option that you want to only enable temporarily for debugging a specific flow. The chances are that you might miss some errors that might be happening earlier in the workflow.
So are there any better ways to efficiently debug the Ionic apps in production?
Yes!
3. Solutions that can record the whole user session
So the idea is that you record whatever the user does (interaction in the app like click or visiting pages) and send it to a remote server. Then you can access an admin dashboard and replay the user’s session. Several platforms provide this type of solution.
LogRocket
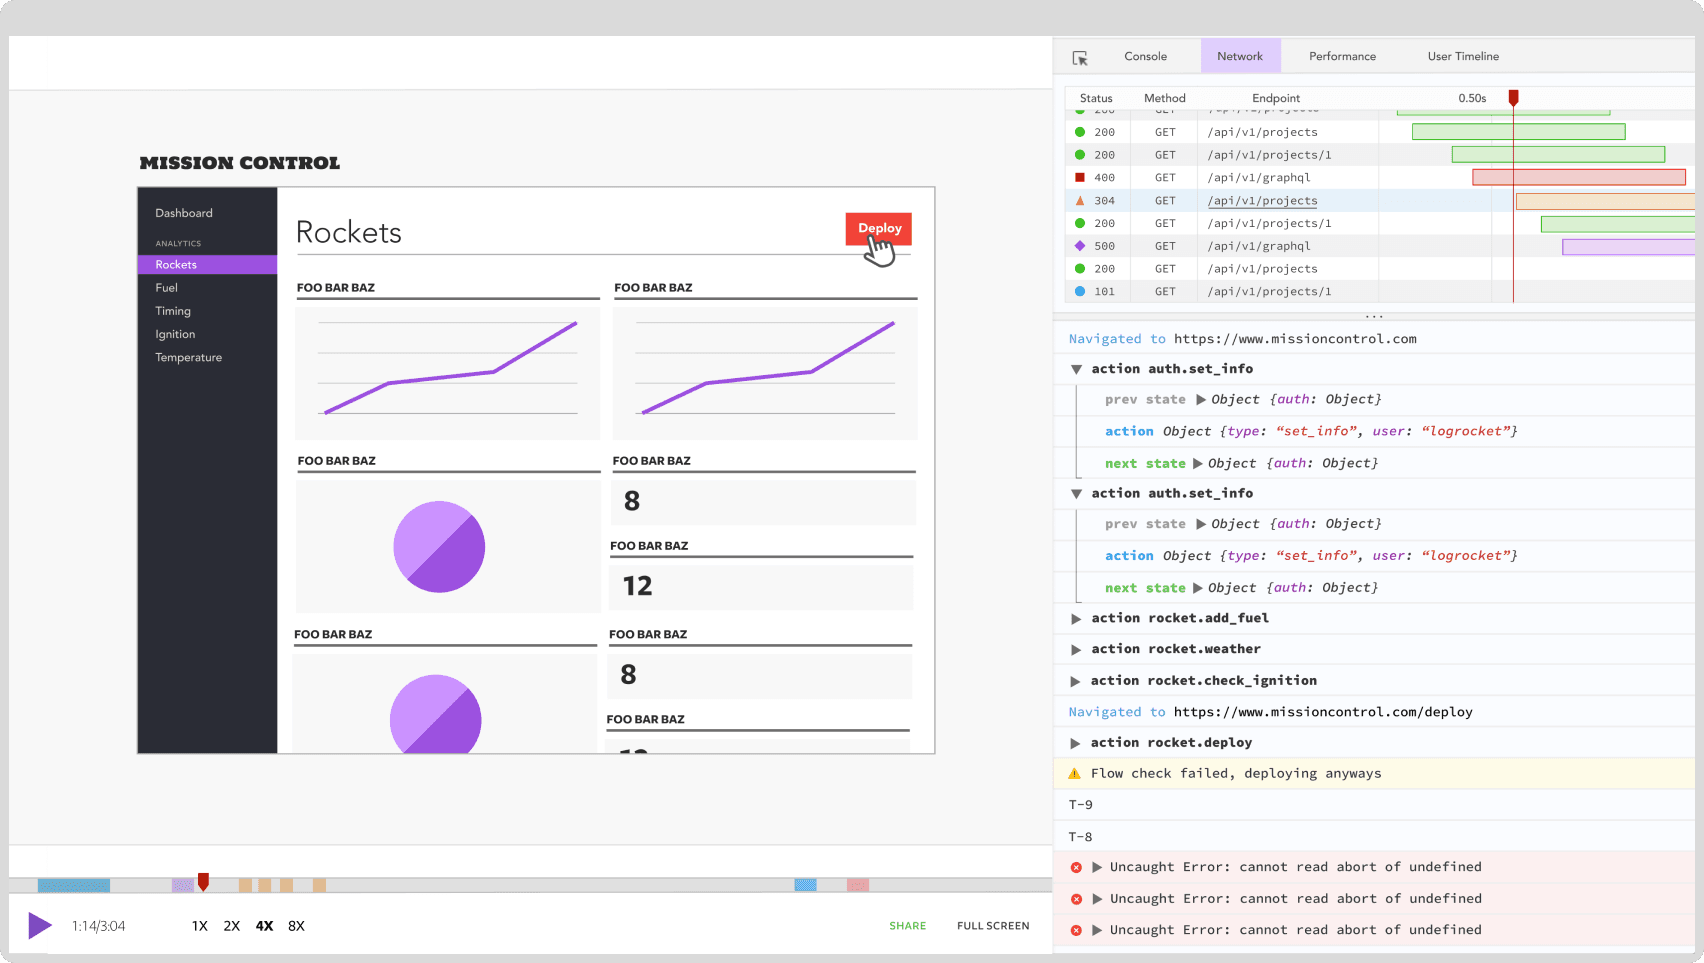
LogRocket lets you replay what users do on your site or hybrid mobile app, helping you reproduce bugs and fix issues faster. With LogRocket, you can replay problems as if they happened in your browser.
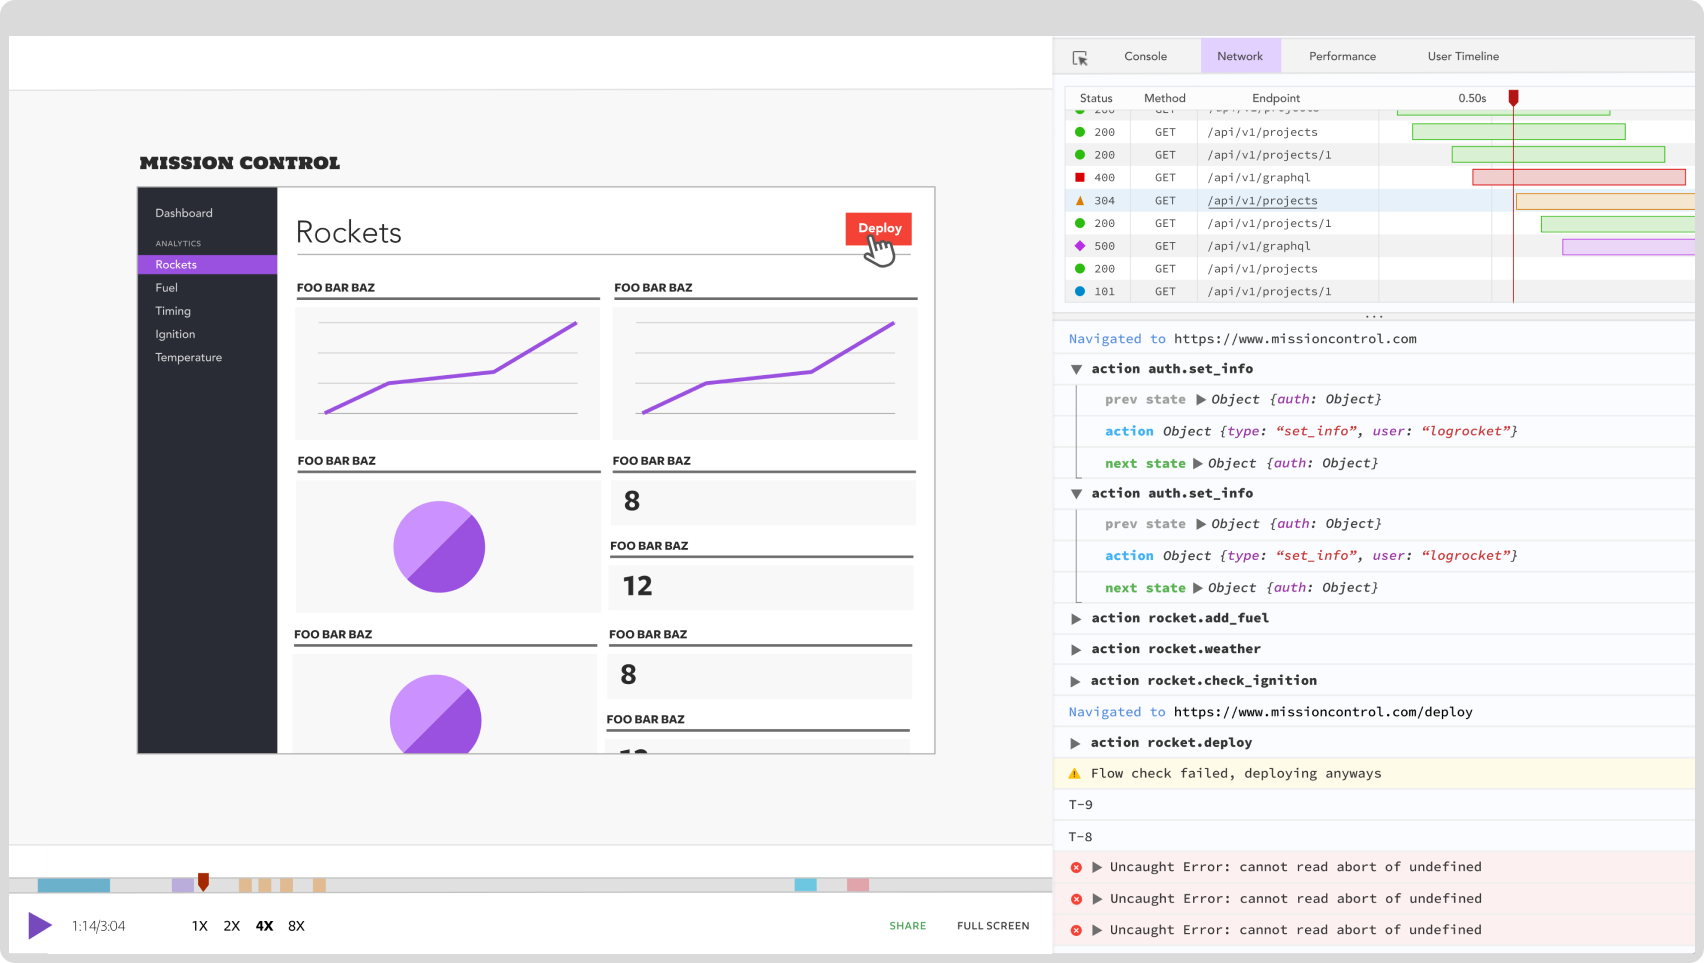
LogRocket lets you:
Session replay See a pixel-perfect replay of what the user saw. LogRocket can recreate the UI/UX of your app for you in its admin console.
**Redux **Inspect actions and state at any point in time.
**Network activity **View every network request and response, including the error code. Quickly find that nasty CORS error or the error related to API.
**Console and errors **Inspect console logs and JavaScript errors
Plus, you can add a user identifier to logs, so you know which session belongs to which user. This method is beneficial during UAT testing. Also, Logrocket provides easy integration with your favourite framework and even Redux state management (it has a middleware for NgRX). So you can see the state changes as if you have access to the browser in debug mode.
Sounds great! Isn’t it? Well, there are some pitfalls!
There is no offline support out of the box. Meaning if a user is offline, LogRocket has no means to keep the device's data and send it later. You can add a service worker to your app and proxy the LogRocket request to provide the offline storage yourself.
If you have a sizeable redux state, it can affect your app's performance and hug too much bandwidth. LogRocket will show you a warning if your state is too large and let you selectively ignore reporting parts of the state.
LogRocket has a free tier and very flexible pricing. So if you have not tried it, I highly recommend it.
I have used LogRocket in many of our Ionic apps, and it makes prod debugging much easier for us. To avoid unnecessary data capture and respect user privacy, we usually avoid sending sensitive data by removing it from the payload that is sent to the LogRocket.
LogRocket session recording is disabled by default in our prod. We only enable it when debugging a specific user problem.
Enabling LogRocket for a specific user is usually triggered by the user by accessing a debug menu in the app. This way, the user will be in control of when their session is recorded.
There is another service called Fullstory, which provides session replay, and I have not used it personally. Also, the pricing seems more expensive than LogRocket.
4. Solutions that can handle runtime errors
There are multiple solutions known as JS error trackers, which can send any runtime error in the JS runtime to a remote server. These errors are usually accompanied by helpful environment and user-session information. Like browser spec, the stack trace of errors, time, location, user id and more.
Also, you can integrate them with other notification services like Slack so you can get real-time feedback from your production and act as quickly as possible to fix user issues.
I usually have Sentry as part of most of the apps I build to make it easier for me to address user issues proactively.
Sentry.io
Sentry provides self-hosted and cloud-based error monitoring that helps all software teams discover, triage, and prioritise errors in real time. Sentry integrates with all major frontend frameworks easily and also has a free tier for you to start with.
TRACKJS
JavaScript Error Logging from TrackJS monitors your web applications for JavaScript errors, alerting you with excellent context about how the user, application, and network got into trouble. Find and fix your bugs fast with TrackJS. Here is a good video by Bas explaining how TRACKJS works.
5. Use google analytics to track exceptions
Google Analytics is a web analytics service offered by Google that tracks and reports website traffic.
Google Analytics is used to track website activity such as session duration, pages per session, bounce rate, etc., of individuals using the site and the traffic source information.
To use Google Analytics for exception reporting, you can send data of any exceptions you are interested in along with custom metrics that you have defined. Then you can make use of Google Analytics reports understanding what type of exceptions happen or how many users get a specific kind of exception.
An example of this use-case can be if many users are searching for a product in your shopping app that you do not provide. This exception is not necessarily an error, but at the same time, it’s valuable stats for you to improve the UI/UX to give the user a better error message or maybe even consider adding that product to your offering.
Conclusion
I hope you have enjoyed reading this article, and please check the first part of this article.
Please leave a comment if you have questions or need help with some specific topic in the Ionic apps debugging.